
Call Abandonment Rate: Benchmarks, Causes, and Fixes
Call Abandonment Rate: Benchmarks, Causes, and Fixes
Your call abandonment rate is the percentage of inbound callers who hang up before reaching an agent, calculated as (contacts abandoned ÷ total contacts offered) × 100. A healthy target for most voice contact centers is generally low; higher values can indicate a service-level problem that needs immediate attention. Three things you can do right now:
- Enable a short-abandon filter (exclude calls under 5–10 seconds) so misdials and network drops don’t inflate your reported rate.
- Offer a virtual callback on queues where wait time regularly exceeds 60 seconds.
- Pull a half-hour staffing report for your peak windows to confirm whether abandonment spikes align with understaffed intervals.
One measurement note: always decide upfront whether your denominator includes or excludes short abandons. That single choice can shift your reported rate by 1.5–3 percentage points, which changes both your benchmark comparison and your remediation priority.
Key Takeaways
| Point | Details |
|---|---|
| Apply the short-abandon filter first | Excluding calls under 5–10 seconds corrects reported rates by 1.5–3 points and prevents misdirected fixes. |
| Callbacks deliver the fastest ROI | Virtual queue and callback implementations commonly reduce abandonment by 30%–50% with low implementation cost. |
| Benchmark by industry, not a universal number | Good rates range from 2–4% in financial services to 5–10% in telecom; compare within your sector. |
| Decompose before you diagnose | Slice abandonment by queue, half-hour interval, and time-to-abandon bucket to identify whether the cause is IVR, capacity, or telemetry noise. |
| Jobospro recovers abandoned call revenue | AI receptionist, missed-call capture, and callback orchestration convert abandoned contacts into booked jobs automatically. |
Table of Contents
- What does call abandonment rate actually measure?
- How do you calculate call abandonment rate?
- What is a good call abandonment rate by industry?
- Why is call abandonment high? The most common root causes
- Ten tactics to reduce call abandonment, in priority order
- Which KPIs should you track alongside abandonment?
- Common mistakes that make abandonment worse
- What technology categories reduce call abandonment fastest?
- How Jobospro maps to the highest-impact abandonment tactics
- A closing perspective on what the data actually demands
- Jobospro recovers the revenue your abandoned calls are leaving behind
- Sources
What does call abandonment rate actually measure?
The formal definition from NiCE is clean: abandonment rate equals contacts abandoned divided by total contacts offered, multiplied by 100. What trips up most teams is the word “abandoned.” Not every disconnected call is an abandoned call.
Abandoned call: The caller reached your queue, waited, and chose to hang up before an agent answered. This is the event your abandonment rate should count.
Dropped call: A technical failure severed the connection. The caller didn’t choose to leave. Counting drops as abandons inflates the metric and sends you chasing a staffing problem that doesn’t exist.
Missed call: The call was never queued. It rang to a line with no capacity, hit voicemail, or went unanswered entirely. Missed calls are a revenue-leak problem, not an abandonment-rate problem, though both cost you customers.
Short abandons sit in a gray zone. A caller who hangs up within 5–10 seconds almost certainly misdailed, hit a wrong menu, or lost signal before the queue even registered. Including those contacts in your denominator and numerator distorts the picture. Most operations teams apply a short-abandon threshold of 5–10 seconds and report two numbers: the raw rate and the adjusted rate. The adjusted rate is what you should benchmark against industry standards and use for SLA targets.
How do you calculate call abandonment rate?
Precision here matters. Sloppy inputs produce a number that looks fine on a dashboard while real callers are walking away.
Standard formula
- Pull your ACD report for the period (day, week, or month).
- Identify total contacts offered: every inbound call that entered your queue, regardless of outcome.
- Identify contacts abandoned: calls where the caller disconnected before agent answer, excluding transfers that failed on the system side.
- Apply the formula: (Contacts Abandoned ÷ Total Contacts Offered) × 100 = Abandonment Rate %
Adjusted (short-abandon filtered) formula
- From your contacts abandoned count, subtract calls that disconnected within your defined short-abandon threshold (typically 5 or 10 seconds).
- From your total contacts offered, subtract the same short-abandon calls.
- Apply: ((Contacts Abandoned − Short Abandons) ÷ (Total Contacts Offered − Short Abandons)) × 100
Worked example
Your ACD reports 1,200 contacts offered in a day. Of those, 96 abandoned. That 1.4-point correction changes whether you’re at a “watch closely” level or a “fix this week” level.
Spreadsheet formula (Google Sheets / Excel):
Assume A1 = total offered, B1 = total abandoned, C1 = short abandons.
=((B1-C1)/(A1-C1))*100
One platform caveat: some ACD systems report “offered” as calls that reached an agent or abandoned, while others include calls that received a busy signal before entering the queue. Confirm your platform’s definition before benchmarking externally.
What is a good call abandonment rate by industry?
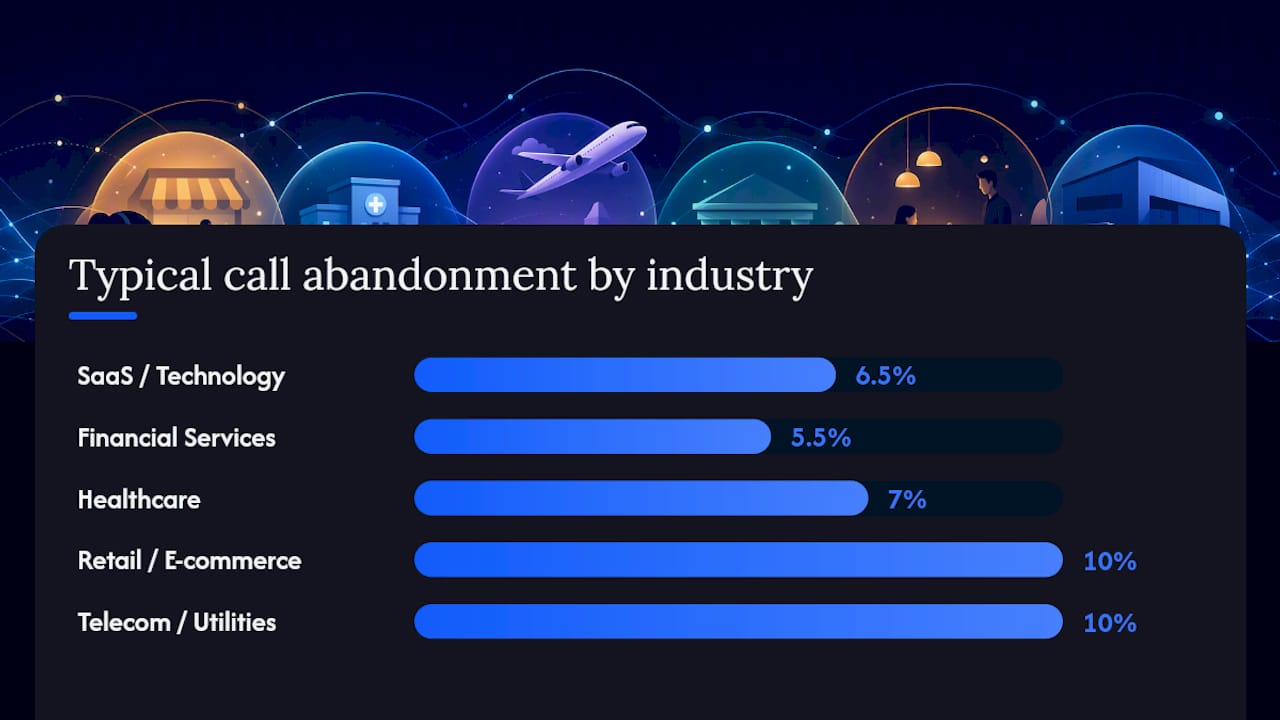
There is no single universal target. The right number depends on your industry, call purpose, and caller patience. KPI Tree’s benchmark data breaks this down by sector and recommends decomposing abandonment by time blocks and queues rather than relying on a single aggregate figure.
| Industry | Good | Typical | Needs Attention |
|---|---|---|---|
| SaaS / Technology | 3–5% | 5–8% | Above 8% |
| Financial Services | 2–4% | 4–7% | Above 7% |
| Healthcare | 2–5% | 5–9% | Above 9% |
| Retail / E-commerce | 5–8% | 8–12% | Above 12% |
| Telecom / Utilities | 5–10% | 10% | Above 10% |
Benchmark signal: Voice abandonment rates above 5–8% generally indicate a service-level problem; rates above 10% suggest a capacity or routing issue that needs escalation, not just monitoring.
Several factors influence where your target should sit:
Call purpose. Sales queues tolerate slightly higher abandonment because motivated buyers will retry. Support queues for billing or outages need tighter control because those callers have no alternative and their frustration compounds.
Short-abandon policy. A team that excludes 10-second calls will report a rate 1–3 points lower than a team counting everything. Before comparing your number to an industry benchmark, confirm both use the same methodology.
Channel mix. Digital-first operations that deflect simple queries to chat or self-service naturally see lower voice abandonment because the remaining callers have complex needs and higher patience.
To set an internal SLA target, start with your adjusted rate today, pick a realistic 30-day improvement goal (typically 1–2 percentage points), and tighten from there over 60 and 90 days.
Why is call abandonment high? The most common root causes
Abandonment rarely has a single cause. The pattern of when callers hang up tells you more than the aggregate number.
- Long wait time (most common): Callers who reach the queue and wait beyond their tolerance threshold hang up. Wait-time tolerance typically sits around 60–90 seconds, and abandonment accelerates sharply after that point. Check first: average speed of answer (ASA) by queue and by half-hour interval.
- IVR friction: A confusing menu, too many layers, or a dead-end option forces callers to hang up before they even reach the queue. Check first: IVR containment rate and the specific menu paths where callers exit.
- Understaffing at peak intervals: Abandonment that spikes at predictable times (Monday morning, post-holiday) almost always traces to a scheduling gap. Check first: half-hour staffing adherence vs. call volume for the same window.
- Failure demand: Callers phoning back because a previous interaction didn’t resolve their issue. Each repeat call adds volume without adding revenue. Check first: repeat-call rate and first-contact resolution (FCR) scores.
- Poor hold experience: Silence on hold accelerates abandonment. Callers who hear nothing assume the system has failed. Periodic queue-position updates and informative hold messaging extend patience.
- Overflow and transfer failures: Calls routed to a secondary queue or external team that then fail to connect register as abandons. Check first: transfer completion rate by destination.
Reading abandon timing as a diagnostic:
- 0–10 seconds: Likely misdials, IVR confusion, or network drops. Apply your short-abandon filter before acting.
- 11–60 seconds: IVR friction or a very short patience threshold. Audit your menu flow.
- 1+ minutes: True wait-time abandonment. The fix is capacity, callbacks, or both.
Ten tactics to reduce call abandonment, in priority order
Start with the highest-impact, lowest-cost changes in weeks 0–4. Move to structural fixes in weeks 5–12.
Weeks 0–4 (quick wins):
1. Enable virtual callback / virtual queue. Offer callers the option to receive a callback instead of waiting. Well-implemented callback systems reduce abandonment by 30%–50% in most deployments. The setup requirement is a callback-capable ACD or a standalone virtual queue tool; the trade-off is a small increase in outbound call volume.
2. Set your short-abandon filter. Decide on a 5- or 10-second threshold and apply it consistently. This doesn’t reduce actual abandonment but stops you from misdiagnosing the problem and wasting effort on IVR rework when the real issue is staffing.
3. Add queue-position announcements. Tell callers where they are in line and give an estimated wait time. Periodic updates every 30–60 seconds extend caller patience and reduce the uncertainty that drives early hang-ups.
4. Audit your IVR for dead ends. Map every path a caller can take and identify options that lead nowhere useful. Remove or redirect them within a single sprint cycle.
5. Activate after-hours self-service. Calls that arrive outside staffed hours and hit a dead-end voicemail are near-certain abandons. A self-service option or an AI receptionist that captures the caller’s intent and schedules a callback converts those contacts into recoverable leads.
Weeks 5–8 (structural improvements):
6. Optimize scheduling with WFM data. Use historical call volume by half-hour to build schedules that match staffing to demand. Workforce management planning and managing after-call work are among the most reliable levers for sustained abandonment reduction.
7. Cross-train agents across queues. Skill-based routing that can flex agents between queues during peaks reduces the chance that one queue spikes while another sits idle.
8. Reduce failure demand. Identify your top repeat-call reasons and fix the upstream process. Fewer repeat calls means lower total volume and lower abandonment without adding headcount.
9. Improve hold experience. Replace silence with music, brand messaging, or self-service prompts. Queue-position updates every 45–60 seconds are the minimum; proactive messaging about known issues (outages, delays) reduces inbound volume at the source.
Weeks 9–12 (optimization):
10. Implement skill-based and priority routing. Route high-value or high-urgency callers to shorter queues. This doesn’t lower your aggregate abandonment rate but protects the contacts that matter most to revenue and retention.
Pro Tip: Before you touch IVR or staffing, measure abandonment in time buckets (0–10s, 11–60s, 1–5 min) by half-hour interval for one full week. That single decomposition will tell you whether you have a telemetry problem, an IVR problem, or a capacity problem, and it will save you weeks of misdirected effort.
Which KPIs should you track alongside abandonment?
Abandonment rate alone can mislead. A team that answers every call in 10 seconds will have near-zero abandonment but may be burning through headcount budget unsustainably. Track these companion metrics to confirm that improvements are real and not creating new problems.
Measuring abandonment in buckets and by interval turns a single percentage into an actionable funnel. Build your dashboard around these dimensions:
| Metric | What it tells you | Review cadence |
|---|---|---|
| Abandonment rate (adjusted) | Core health signal after short-abandon filter | Daily, by queue |
| Average speed of answer (ASA) | Whether wait time is the driver | Daily, by half-hour |
| Service level (% answered in X seconds) | SLA compliance | Daily |
| First-contact resolution (FCR) | Whether failure demand is growing | Weekly |
| Average handle time (AHT) | Agent capacity and after-call work | Daily |
| Callback acceptance rate | Whether your callback offer is working | Daily when active |
| Time-to-abandon distribution | Diagnostic: IVR vs. wait vs. capacity | Weekly |
| Answer rate | Complement to abandonment; catches missed calls | Daily |
Running a simple A/B test when you enable callbacks: Split your queue by day of week for two weeks before launch (baseline), then run callbacks for two weeks (test period). Compare adjusted abandonment rate, ASA, and callback acceptance rate across the two windows. Control for volume differences by comparing rates, not raw counts.
Common mistakes that make abandonment worse
Getting the metric right is half the battle. These are the errors that undo good work.
- Optimizing the number, not the experience. Answering calls faster by cutting handle time creates worse FCR, which drives failure demand and raises volume. Watch FCR and repeat-call rate alongside abandonment.
- Forgetting to set a short-abandon threshold. Teams that count every disconnect inflate their rate and often rework their IVR when the real problem is misdials. Set the threshold before you start any remediation.
- Overstaffing to hit a target. Adding agents to crush abandonment below 2% in a retail queue may cost more than the revenue you recover. Set targets that reflect your industry benchmark, not an arbitrary round number.
- Reporting aggregate abandonment only. A 6% overall rate can hide a 20% rate on one queue and a 2% rate on another. Always slice by queue before drawing conclusions.
- Ignoring callback abandonment. Callers who accept a callback and then don’t answer when you call back are a secondary abandonment event. Track callback completion rate separately.
- Treating abandonment as a staffing problem exclusively. IVR friction, poor hold experience, and failure demand each contribute. A staffing fix alone rarely solves more than half the problem.
What technology categories reduce call abandonment fastest?
The right tools accelerate every tactic above. Here are the categories to evaluate and the features that matter most for reducing abandonment.
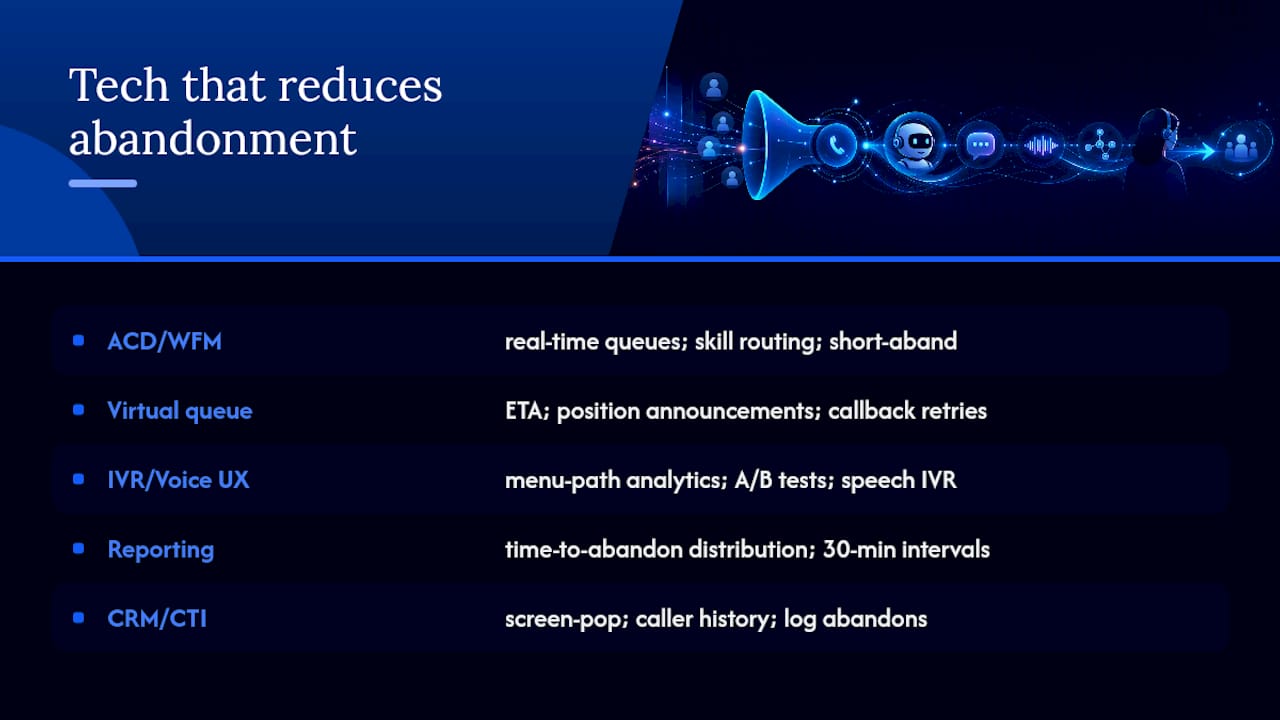
ACD / Workforce Management (WFM): Look for real-time queue visibility, half-hour interval reporting, short-abandon filtering, skill-based routing, and schedule-adherence alerts. Without these, you’re managing abandonment blind.
Virtual queue / callback systems: The non-negotiable features are estimated wait-time calculation, queue-position announcements, and outbound callback dialing with retry logic. Confirm the system integrates with your ACD so callback data flows into the same abandonment report.
IVR / voice UX platforms: Evaluate menu-path analytics (where callers exit), A/B testing for menu options, and the ability to add or remove options without a developer. Speech-enabled IVR reduces friction for callers who can’t navigate DTMF menus.
AI receptionist: An AI receptionist handles after-hours calls, captures caller intent, and schedules callbacks automatically. For home service businesses especially, this converts what would be a missed call into a recoverable lead rather than a lost job.
Reporting and analytics: You need time-to-abandon distribution, per-queue abandonment, interval-level reporting, and the ability to export to a BI tool. Platforms that only report aggregate daily abandonment are insufficient for operational decision-making.
CRM / CTI integration: Screen-pop on callback, caller history at the agent’s fingertips, and automatic logging of abandoned contacts into a follow-up queue. Without CRM integration, recovered callbacks are handled cold, which lowers conversion and increases handle time.
Vendor evaluation questions to ask: Does your platform report short abandons separately? Can I set a custom short-abandon threshold? Does the callback system retry unanswered callbacks? Can I see abandonment by queue and by 30-minute interval in real time?
How Jobospro maps to the highest-impact abandonment tactics
For home service businesses, abandoned calls aren’t just a service metric. They’re direct revenue leakage. Jobospro’s revenue leak research identified $2.3 billion in recoverable revenue across home service franchise networks, with missed and abandoned calls as a primary driver.
Jobospro’s AI-native platform addresses the tactics above at the operational level:
- AI receptionist (Kate): Answers calls after hours, captures caller intent, and schedules callbacks automatically, converting abandoned contacts into booked jobs rather than lost leads. See how Kate works for franchise networks.
- Missed-call capture: Every unanswered or abandoned call is logged, flagged, and routed into an automated follow-up sequence so no contact falls through the gap.
- Callback orchestration: Automated outbound callbacks with retry logic, integrated directly into the dispatch and scheduling board.
- Real-time queue intelligence: Live visibility into call volume, wait times, and abandonment by location, so multi-location operators can spot a spike at one site before it becomes a pattern.
- Multi-location benchmarking: Franchise operators can compare abandonment rates across locations, identify which sites are underperforming, and replicate the scheduling or routing practices of top performers.
The platform integrates with existing tools like Jobber and QuickBooks, so you’re adding intelligence to your current stack rather than replacing it.
A closing perspective on what the data actually demands
Most contact center teams treat call abandonment rate as a staffing problem. Fix the schedule, hire more agents, done. That framing misses the more expensive half of the problem.
The callers who abandon after 90 seconds aren’t just impatient. They’ve already decided your business isn’t worth the wait. In home services, that decision costs you a job, a review, and often a repeat customer. The teams that move the needle fastest are the ones who decompose abandonment by time bucket and queue before touching a single schedule or IVR menu. They find that a third of their “abandonment problem” is actually a short-abandon counting error, another third is an IVR dead end that takes two hours to fix, and only the remaining third requires a staffing conversation. That sequencing saves weeks of effort and avoids the perverse outcome of overstaffing a queue that didn’t need it.
The 30/60/90 plan in this article reflects that order of operations. Start with measurement, then fix the cheap things, then invest in capacity.
Jobospro recovers the revenue your abandoned calls are leaving behind
Every abandoned call in a home service business is a potential job that walked out the door. Jobospro is built specifically to stop that leak, automatically and without adding headcount.
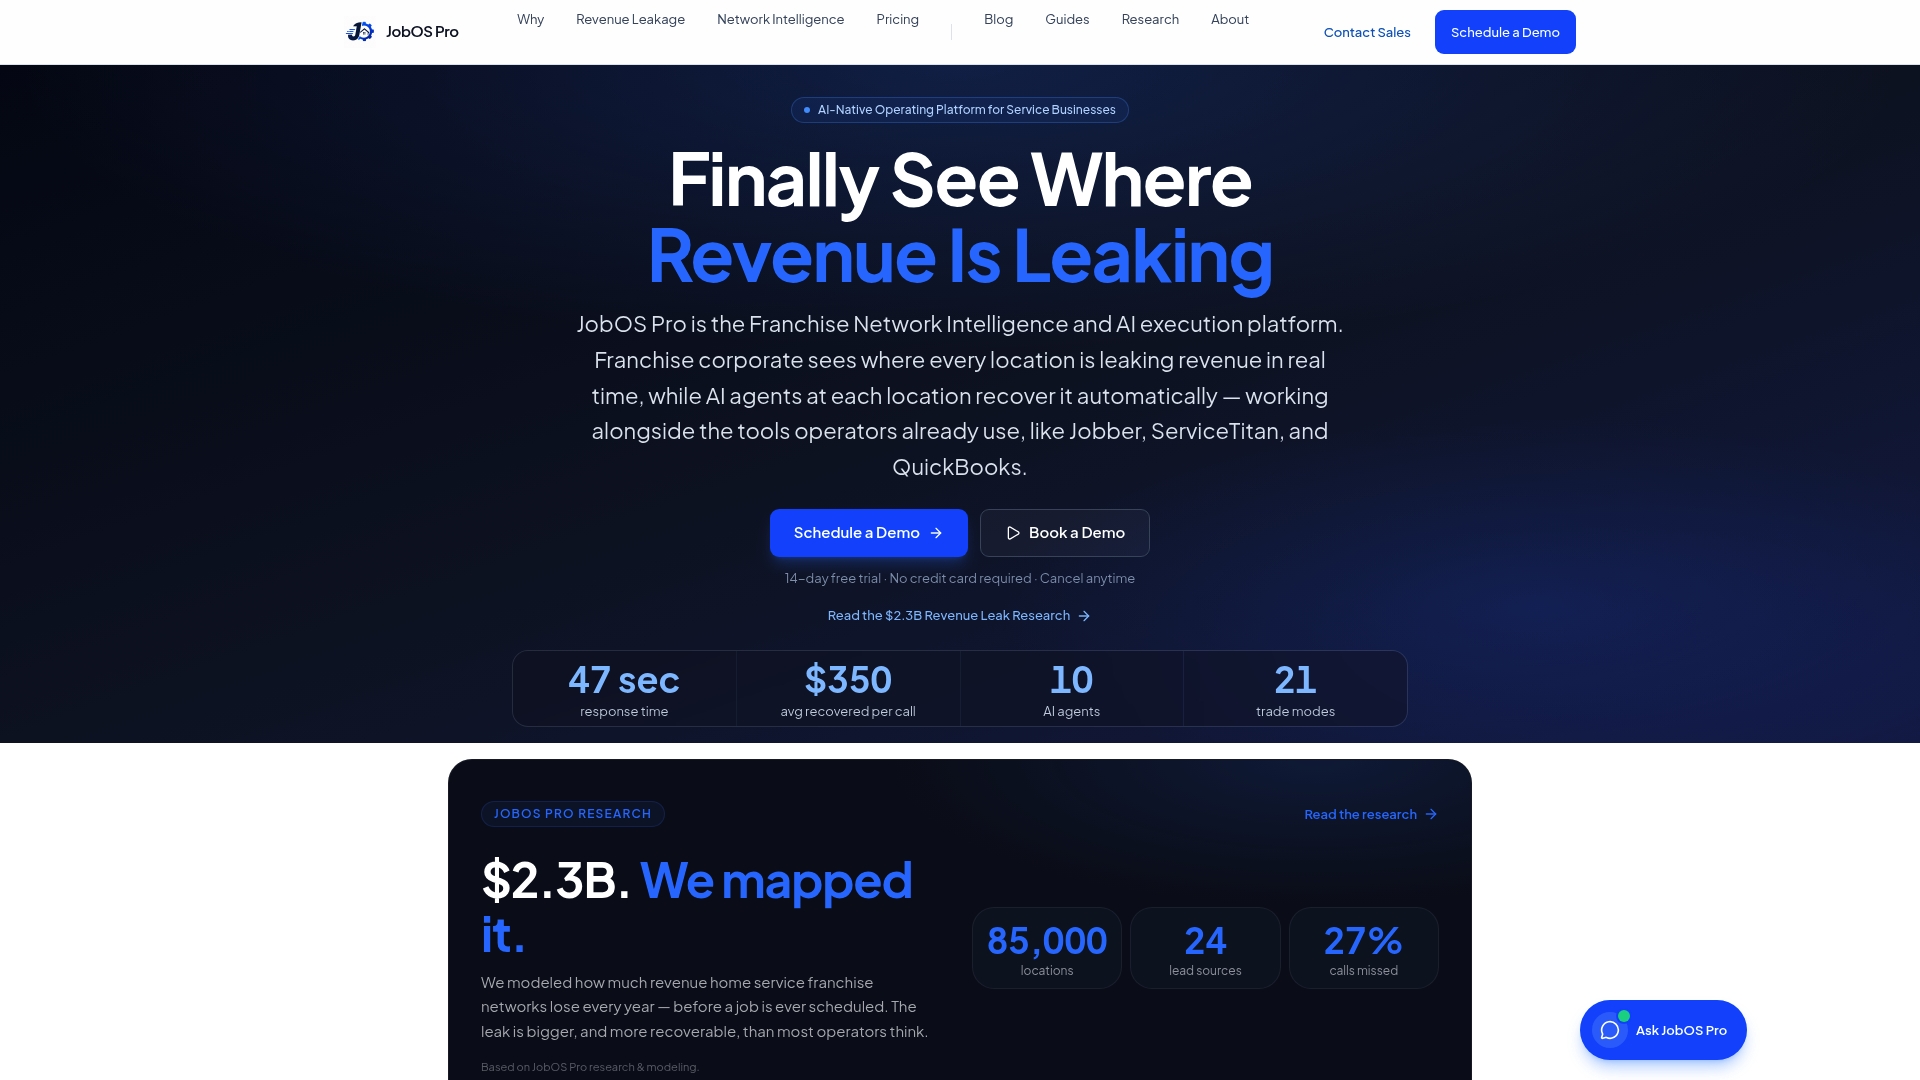
The platform’s AI receptionist answers calls around the clock, captures caller intent, and triggers a callback or booking sequence before the lead goes cold. Missed-call recovery, callback orchestration, and real-time abandonment reporting are built into the same platform, so your team sees the full picture in one place rather than stitching together three tools.
Franchise operators get an additional layer: cross-location benchmarking that shows which sites have the highest abandonment and which scheduling or routing practices are driving the best results elsewhere in the network.
Download the Home Service Owner’s Guide to AI Dispatch to see how operations leaders are using AI to recover missed revenue and reduce abandonment without overhauling their existing systems.
Sources
- What Is Abandonment Rate in Contact Centers? | NiCE
- Call Abandonment Rate: Definition, Formula & Benchmarks - KPI Tree
- Call Center Abandonment Rate: Why Callers Hang Up & How to Fix It | ViciStack Blog
- 10 Ways to Improve Call Abandon Rate
- Reduce call abandonment fast | UCall Blog