
Stop Missed Jobs in 7 Days With AI Forecasting for Home Services
Stop Missed Jobs in 7 Days With AI Forecasting for Home Services
Use a 7-day rolling demand forecast to set technician shifts and a small safety buffer, then update it daily. Staff to forecasted technician-hours, not to last month’s average, and protect revenue by recovering the jobs you would otherwise miss. Start today: build a 7-day rolling forecast and connect your main lead source to your schedule board. An AI-native platform can automate most of this once the habit is in place.
TL;DR:
- Small operations should update a 7-day rolling demand forecast daily and connect it to their scheduling system to improve accuracy and responsiveness.
- Using historical data, lead source performance, and seasonality patterns can generate simple, effective forecasts with a 10% to 20% error margin for most small businesses.
- Converting forecasted jobs into staffing requires adding a safety buffer of 5% to 15%, depending on demand volatility, and prioritizing skills, geography, and high-margin jobs.
- Automating forecast-based actions like shift recommendations, missed-call follow-ups, and invoicing can significantly reduce manual work and revenue leakage.
- Regular, small updates and real-time adjustments outperform infrequent, large revisions, enabling better capacity management and customer service.
Table of Contents
- Why Demand Forecasting Matters for Your Bottom Line
- Core Inputs and Simple Forecasting Methods You Can Start This Week
- Turning Forecast Numbers Into Shifts and Routes
- Managing Uncertainty Across Different Planning Horizons
- Tools and Integrations That Turn Forecasts Into Action
- What Successful Forecasting Looks Like in Practice
- The First Thing to Change This Week
- Put Your Forecast on Autopilot With JobOS Pro
- FAQ
- Sources
Why Demand Forecasting Matters for Your Bottom Line
Forecasting isn’t a planning exercise you do once a quarter. It’s the lever that decides whether your technicians sit idle on a Tuesday or scramble through unpaid overtime on a Friday. Get it wrong consistently and the costs compound: overtime premiums eat margin, missed appointments turn into one-star reviews, and good technicians quit crews that swing between overload and downtime.
A handful of numbers tell you whether forecasting is working:
- Booked jobs versus forecast: the gap between predicted and actual volume each week.
- Lead-to-book conversion rate: how many inbound calls or forms turn into scheduled jobs.
- Technician utilization: productive hours worked against hours paid.
- No-show and cancellation rate: jobs lost after they were already on the board.
- Average ticket size: whether staffing decisions are protecting your highest-margin work.
A plumbing operator who underforecasts a storm-driven spike by even a day typically loses the jobs to a competitor who answered the phone first. Overforecast consistently and you’re paying technicians to wait around. Track these metrics weekly during rollout, not monthly, since early misses are cheap to fix and expensive to ignore.
Core Inputs and Simple Forecasting Methods You Can Start This Week
You don’t need a data science team to build a usable forecast. You need consistent inputs and a method you’ll actually update.
Collect these before you build anything:
- Historical job counts by day and hour, going back at least 8 to 12 weeks.
- Lead counts by source (phone, web form, referral, marketing campaign).
- Conversion rate from lead to booked job, by source.
- Average job duration by service type.
- Technician skills and shift patterns, including who’s certified for what.
- Marketing calendar, so you know when a promotion will spike leads.
- Weather outlook, especially for HVAC, roofing, and landscaping.
With that in hand, three simple recipes cover most operators:
- 7-day and 28-day moving averages with a weekday adjustment for routine volume, since Monday rarely looks like Saturday.
- Multiplicative seasonality for month-to-month or season-to-season swings, multiplying your baseline by a seasonal index rather than just adding a flat number.
- A quick regression against ad spend or campaign dates when a marketing push reliably moves lead volume.
Apply manual overrides for promotions, severe weather, or local events. These recipes catch pattern-driven demand, not one-off shocks. For anything beyond that, rolling-horizon approaches outperform static benchmarks on schedulability and computation time, but they also demand more data and computing power than a spreadsheet moving average. Start simple and escalate only when the simple method starts missing.
Pro Tip: Rebuild your moving average every Sunday night using the latest 7 and 28 days of bookings, so Monday’s shift plan reflects what actually happened last week, not what you assumed three weeks ago.
Turning Forecast Numbers Into Shifts and Routes
A forecast is only useful once it becomes a staffing decision. The conversion is mechanical:
- Forecasted jobs multiplied by average job duration gives you total required technician-hours for the period.
- Divide that by productive hours per technician (actual hours worked, not scheduled hours) to get required headcount.
- Add a safety buffer of 5% to 15%, sized to how volatile your demand has been; a landscaping crew with weather-driven swings needs a bigger buffer than an indoor cleaning service.
- Decide overtime versus temp labor in advance: overtime covers short, predictable gaps; temp labor covers sustained volume above your core crew’s capacity.
Once headcount is set, dispatch priorities determine whether that capacity gets used well:
- Match skill to job first, since a misassigned technician burns hours even when headcount looks right.
- Cluster appointments by geography to cut windshield time between jobs.
- Protect high-margin appointments from being bumped when the board fills up.
- Minimize total travel distance across the day, not just between consecutive stops.
Service time tends to dominate travel time in field operations, so routing research built on real scheduling constraints consistently finds that multi-period, rolling-horizon planning beats fixed weekly schedules on both coverage and feasibility. Translating forecast into shift plan is where most of the operational value gets captured, more than in chasing a slightly more accurate number.
Managing Uncertainty Across Different Planning Horizons
No forecast is exact, so the goal is matching your response to the right time horizon, not eliminating error.
- Real-time horizon (hours): dispatch adjustments, filling a cancellation, reassigning a technician already on the road.
- Short horizon (1 to 7 days): the rolling forecast that drives this week’s shift plan and safety buffer.
- Medium horizon (4 to 12 weeks): capacity planning, hiring decisions, and seasonal staffing ramps.
Each horizon has its own tolerance for error. A small operation running a 7-day forecast should expect to land within a 10% to 20% mean absolute error before the forecast is worth trusting for staffing, a range consistent with what rolling-horizon scheduling research treats as a reasonable operating band for field-service planning under uncertainty.
When error exceeds that band, act in order:
- Reassign shifts among technicians already scheduled before adding labor.
- Call in temp labor or part-time technicians for a confirmed gap, not a suspected one.
- Offer short-term incentives to fill unpopular shifts rather than forcing overtime on the same few people every week.
Set a weekly review where you compare forecast to actual, log the gap, and adjust next week’s weekday or seasonal index accordingly. That five-minute habit catches drift before it becomes a staffing crisis.
Tools and Integrations That Turn Forecasts Into Action
A forecast sitting in a spreadsheet changes nothing by itself. The value shows up when it automatically becomes a shift recommendation, a follow-up call, or an invoice reminder.
To get there, you need these systems talking to each other:
- Lead and booking sources (phone, web forms, booking widgets) feeding directly into your schedule board.
- Dispatch and scheduling software that can accept forecast-driven shift recommendations, not just manual entries.
- Payroll and accounting systems that reflect actual hours worked against forecasted hours.
- Marketing calendar integration so campaign-driven spikes show up in the forecast automatically instead of catching the office by surprise.
An AI-native platform closes that loop: it reads forecast signals and converts them into recommended shifts, follows up automatically on missed calls, and sends invoice reminders without someone manually checking a dashboard. We built JobOS Pro around exactly this gap between forecasting and action, connecting to tools operators already use like Jobber and QuickBooks rather than requiring a rebuild. Industry research has found that missed calls, uncollected payments, and scheduling delays bleed meaningful revenue across the industry, which is the gap automated follow-up and dispatch recommendations are built to close. Franchise operators get multi-location intelligence on top, letting corporate teams benchmark forecast accuracy and safety-buffer policy across every site from one dashboard.
Pro Tip: When evaluating a platform, test whether it recommends a specific staffing action from your forecast, not just a chart. A dashboard that shows demand without a recommended shift is still manual work.
What Successful Forecasting Looks Like in Practice
The pattern across operators who get this right is consistent: small, frequent updates beat big, infrequent ones.
An HVAC company watching weekday-adjusted moving averages through a shoulder season can catch a three-day cooling spike early enough to add a temp technician before call volume outpaces capacity, rather than discovering the gap from a pile of unanswered calls on Thursday. A landscaping crew that layers weather forecasts on top of its 28-day baseline avoids the common trap of overstaffing for a rain week that never produces mowing jobs, while still having coverage ready the moment the ground dries out.
The common thread in both cases isn’t model sophistication. It’s connecting the forecast to a specific, mechanical action: a shift gets added, a technician gets reassigned, a follow-up call goes out. Our blog on revenue leakage walks through specific scenarios, including how following up on open estimates recovers jobs that a forecast alone would never flag, since the demand was already there and simply went unclaimed. Multi-location operators tend to see the clearest wins when one location’s successful buffer percentage or dispatch rule gets standardized across the network instead of staying siloed in one manager’s head.
Forecasting accuracy matters less than what happens in the ten minutes after the forecast lands on someone’s screen.

The First Thing to Change This Week
If you change one thing, make it this: build the 7-day rolling forecast and connect your busiest lead source to the schedule board before Friday. Track fill rate for one week. Franchise owners should roll the same dashboard to every location and standardize one safety-buffer percentage across the network.
— Tarun
Put Your Forecast on Autopilot With JobOS Pro
Building the forecast is the easy part. Keeping it connected to dispatch, follow-up, and invoicing every single day is where most operators fall behind, and that’s the gap we built JobOS Pro to close.
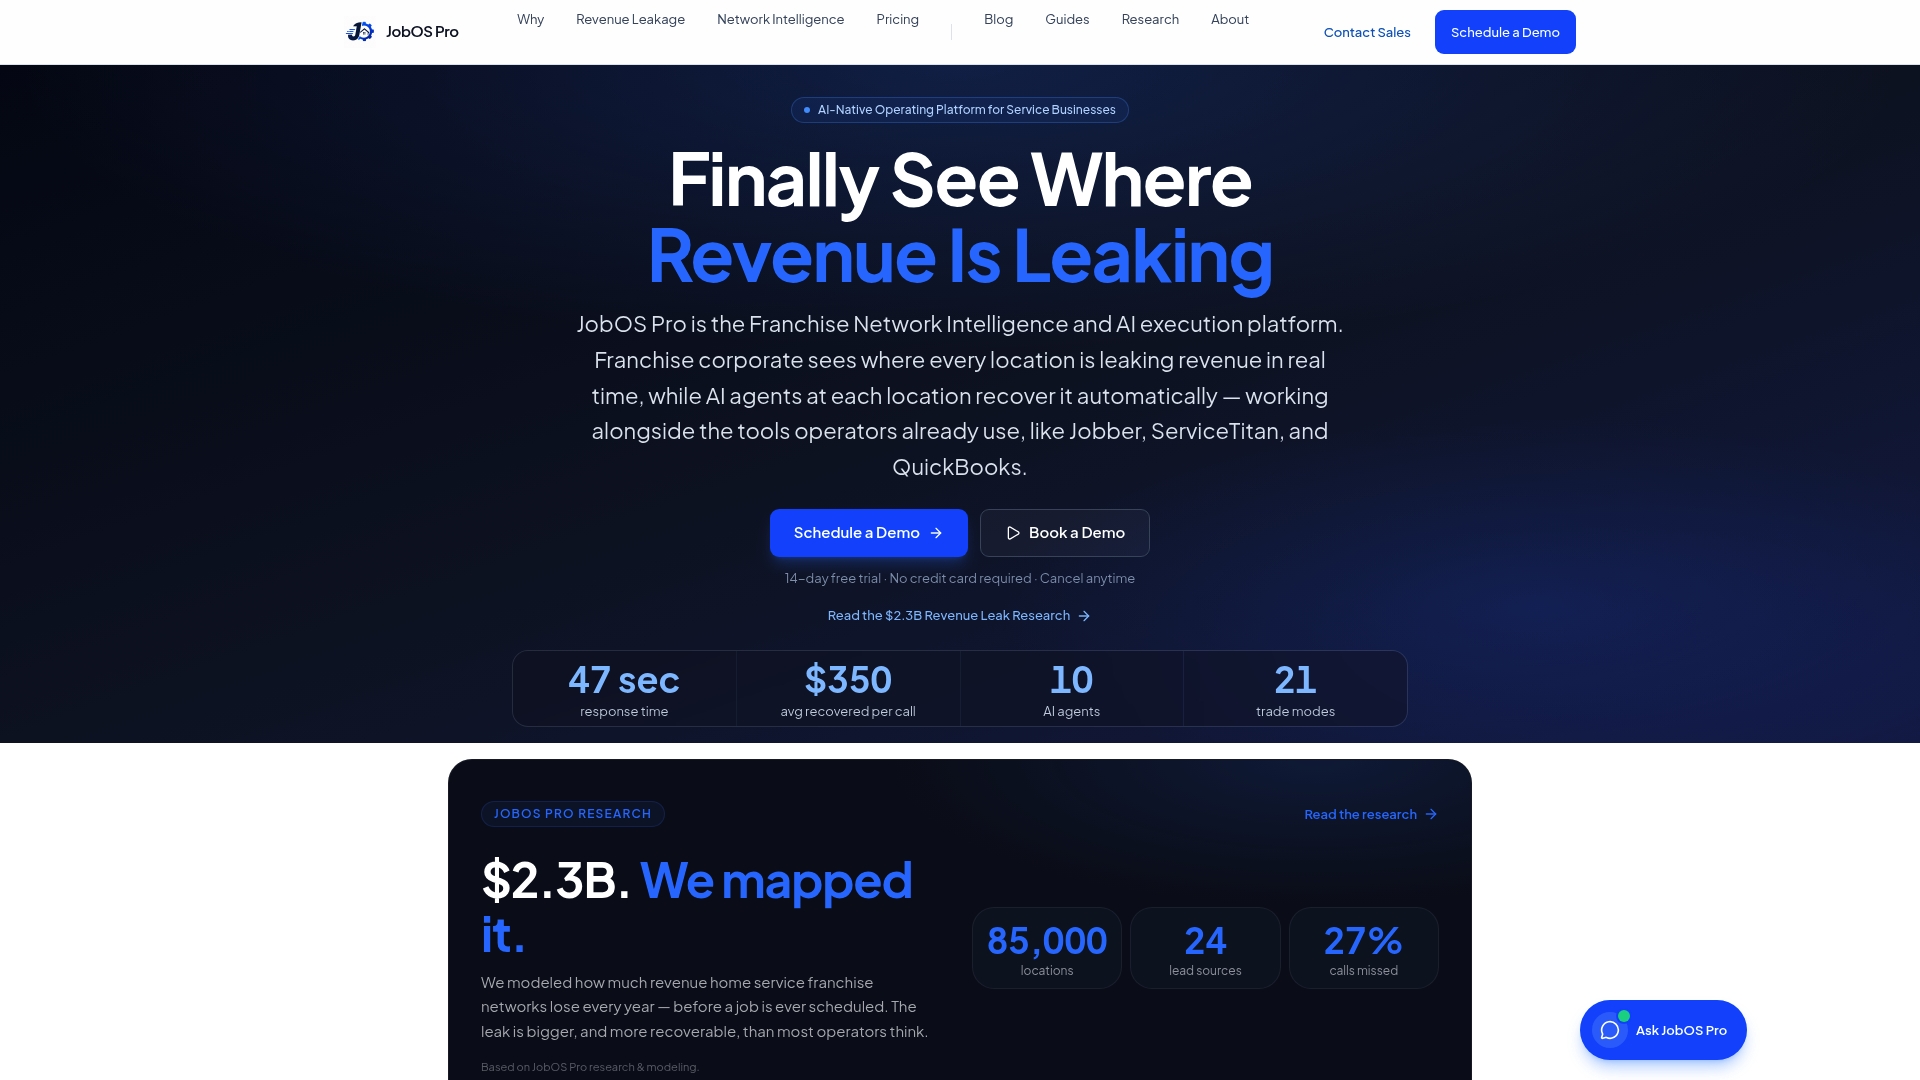
With such a platform, you get:
- Automated missed-call recovery, so a forecasted lead never goes unanswered.
- Forecast-driven dispatch recommendations, turning your weekly numbers into actual shift suggestions.
- Multi-location benchmarking, so franchise leaders can compare fill rate and buffer policy across every site.
See how it fits your operation with a demo, or check Starter, Growth, Pro, and Enterprise pricing starting at $199 per month.
FAQ
What is demand forecasting for home service businesses?
Demand forecasting for home services means predicting job volume, leads, and staffing needs ahead of time so you can schedule technicians, set safety buffers, and avoid missed revenue. It relies on inputs like historical bookings, lead counts, and seasonality rather than guesswork.
How far ahead should a home service business forecast?
Most operators need three horizons: real-time for same-day dispatch adjustments, a 7-day rolling forecast for weekly shift planning, and a 4 to 12 week horizon for hiring and capacity decisions. Each horizon drives a different kind of decision, so one forecast rarely serves all three.
How big should a staffing safety buffer be?
The right size depends on how much your actual demand has historically deviated from your forecast.
What forecast error is acceptable for a small home service operation?
A 7-day rolling forecast with a mean absolute error of 10% to 20% is a reasonable operating range for most small field-service operations. Errors beyond that band usually call for corrective action like reassigning shifts or bringing in temp labor.
Can software automate demand forecasting for home services?
Yes. An AI-native platform can connect your lead sources, scheduling board, and accounting system so forecast signals turn into automated actions like missed-call recovery, shift recommendations, and invoice reminders without manual dashboard checks.