First Time Fix Rate: What It Is and How to Raise It
First Time Fix Rate: What It Is and How to Raise It
First-time fix rate (FTFR) is the percentage of service jobs a technician resolves completely during the initial visit, with no follow-up trip, no escalation, and no waiting on parts. The formula is simple: (jobs fixed on the first visit ÷ total jobs) multiplied by 100 (expressed as a percentage). If your team closes a large majority of jobs on the first try, your FTFR reflects a strong first-time fix rate.
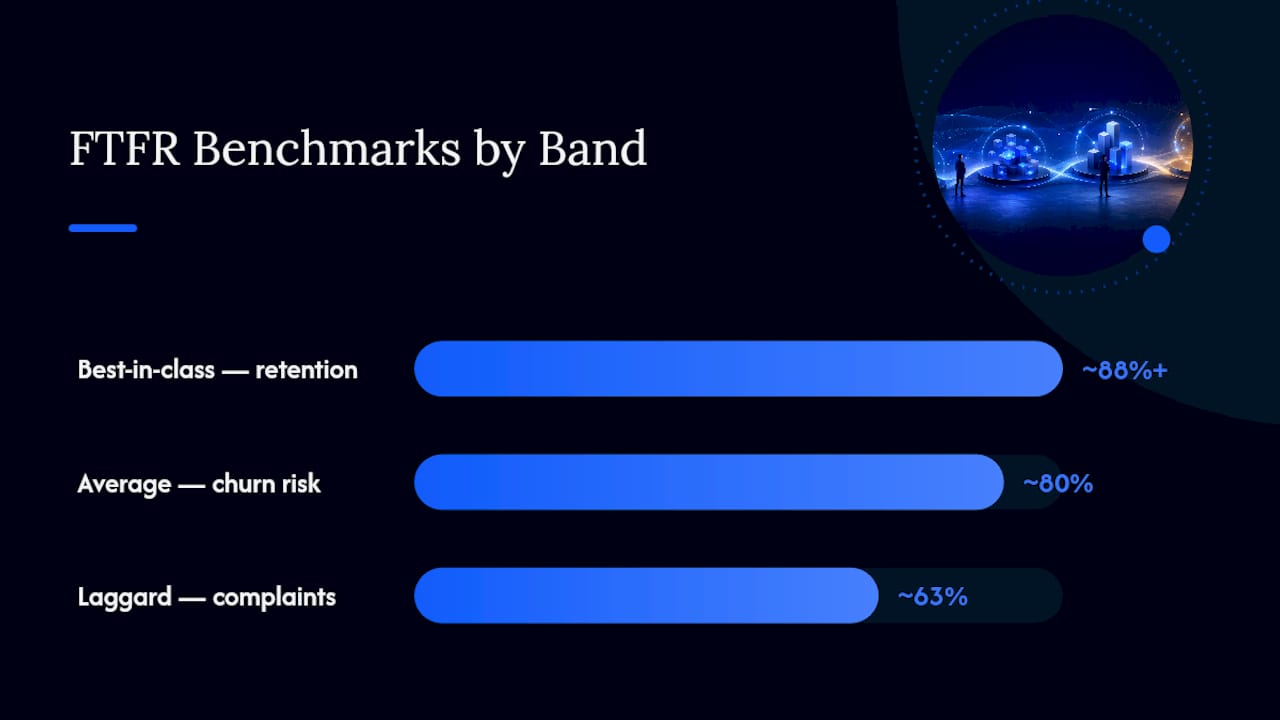
Here’s how that math plays out in practice. A regional HVAC operator running 400 calls a month with 320 first-visit resolutions lands at an average first-time fix rate (320 ÷ 400 × 100). That number alone tells you where you stand: best-in-class operators run near 88% FTFR, average performers have an average first-time fix rate, and laggards fall closer to 63%.
- Best-in-class: ~88% and above
- Average: ~80%
- Laggard: ~63% or below
Quick benchmark check: If your FTFR falls below a moderate threshold, you’re likely losing money on a significant portion of jobs through repeat dispatches, wasted drive time, and frustrated customers who start shopping around for a new provider.
Key Takeaways
Raising first-time fix rate consistently requires fixing parts availability, matching technician skill to job type, and measuring the metric with consistent exclusion rules.
| Point | Details |
|---|---|
| Know your baseline | Calculate FTFR as (first-time fixes ÷ qualifying jobs) × 100, excluding planned multi-visit work. |
| Benchmark honestly | Compare your number against the ~88% best-in-class, ~80% average, and ~63% laggard bands. |
| Fix parts first | Pre-dispatch kitting and parts reservation address the most common cause of repeat visits. |
| Pilot before scaling | Test one capability, like van inventory plus parts reservation, for 30 to 60 days before a full rollout. |
| Use a connected platform | Jobospro links dispatch, inventory, and intake into one system so FTFR gaps surface automatically instead of hiding across disconnected tools. |
Table of Contents
- What Counts as a First-Time Fix?
- How Does FTFR Differ From First Contact Resolution?
- How Do You Calculate FTFR Step by Step?
- What Are Typical FTFR Benchmarks and Their Cost Impact?
- What Causes Low First-Time Fix Rates?
- How Can You Improve First-Time Fix Rate?
- How Does Software and AI Improve First-Time Fix Rate?
- How Do You Measure and Report FTFR Correctly?
- What Does a 30/60/90-Day FTFR Action Plan Look Like?
- Where Do Field Teams Typically Get Stuck on FTFR?
- How Can Jobospro Help Raise Your First-Time Fix Rate?
- Frequently Asked Questions
- Sources
What Counts as a First-Time Fix?
A job counts as a first-time fix only when the technician resolves the customer’s issue completely on that single visit, with no return trip required for the same problem. That sounds obvious until you start tracking real jobs, where the edge cases pile up fast.
IBM’s definition of FTFR draws a clean line: a true first-time fix has no follow-up visit, no expedited part shipped after the tech leaves, and no escalation to a specialist or second crew. Anything that requires the customer to schedule another appointment for the same root cause breaks the streak, even if the technician diagnosed the problem correctly on visit one.
Certain appointment types should never enter your FTFR calculation at all:
- Multi-day installations planned from the start (a new HVAC system install, a full panel upgrade)
- Scheduled preventive maintenance visits with no reported fault
- Projects explicitly quoted and booked as multi-visit work
Including these artificially depresses your FTFR and buries what’s actually happening in reactive service, which is the segment that matters most for this metric.
A few gray areas deserve specific rules. If a technician orders a part and it arrives within 24 hours for a same-day return visit, most operators still count that as a fix miss, because the customer experienced a second disruption. Remote-assisted fixes, where a technician talks a customer through a reset over video, generally count as resolved if no physical revisit happens. Customer-requested rechecks, where nothing was actually wrong, shouldn’t count against the technician at all.
Pro Tip: In mixed reactive and preventive-maintenance environments, tag every job by type at intake, not at closeout. Techs closing out jobs under time pressure will misclassify edge cases in whatever direction is easiest, which quietly corrupts your data over a full quarter.
How Does FTFR Differ From First Contact Resolution?
FTFR and First Contact Resolution (FCR) measure two different moments in the service journey, and confusing them leads managers to optimize the wrong team.
FTFR tracks what happens on-site — did the technician fix the problem during the physical visit? FCR tracks what happens before dispatch — did the contact center or virtual agent resolve the issue over the phone or chat without ever sending a truck. IBM frames FCR as a pre-dispatch metric that measures intake and remote troubleshooting effectiveness, while FTFR measures the field team’s execution once they’re standing in front of the equipment.
Both matter, but they pull different levers:
- FTFR depends on parts availability, technician skill, and diagnostic accuracy in the field.
- FCR depends on triage scripts, remote diagnostics, and the customer’s own troubleshooting willingness.
- Truck-roll rate tracks how often dispatch happens at all, which FCR directly reduces.
- Technician utilization measures how much of a tech’s paid time goes to billable work versus travel and rework.
- Mean time to repair (MTTR) measures speed once a tech is on-site, regardless of whether the fix holds.
- SLA compliance tracks whether you hit contractual response windows, independent of fix quality.
A field service manager running mostly reactive dispatch (broken furnace, leaking pipe) should weight FTFR heaviest, since most of the resolution burden sits with the technician. A contact-center-heavy operation with remote diagnostics capability should watch FCR just as closely, because every issue resolved by phone is a truck roll you never had to pay for.
How Do You Calculate FTFR Step by Step?
Calculating FTFR correctly takes more than plugging numbers into the formula once. Here’s the repeatable process:
- Define your job pool. Pull all completed reactive service jobs for the reporting period, excluding planned multi-visit work and scheduled PM visits with no fault reported.
- Tag each job as fixed or not fixed on first visit. Use your exclusion rules consistently: no follow-up visit for the same root cause, no expedited part shipped afterward, no escalation.
- Count total first-time fixes. Sum every job tagged as resolved on visit one.
- Count total qualifying jobs. This is your denominator, after exclusions.
- Apply the formula: (first-time fixes ÷ total qualifying jobs) × 100.
- Segment the result by technician, job type, and region to find where the average is hiding weak spots.
Here’s a worked example. A plumbing company logs 600 qualifying reactive jobs in a month. Of those, 492 were resolved on the first visit, 60 required a return trip for the same issue, and 48 were excluded as planned multi-day work.
Aggregate FTFR tells you how the business is doing. Segmented FTFR tells you what to fix. A deep-knowledge review of FTFR reporting makes the case that measuring by job type and technician skill level surfaces opportunities an averaged number simply cannot show.
On reporting cadence: track FTFR monthly for operational decisions, but review quarterly trends for staffing and training investments. Use a minimum sample of 30 to 50 jobs per segment before trusting the percentage. Most modern field service management (FSM) platforms auto-classify jobs using visit history and part-order timestamps, which is far more consistent than relying on technicians to self-report at closeout.
What Are Typical FTFR Benchmarks and Their Cost Impact?
Benchmark bands vary by sector, but the pattern holds across HVAC, plumbing, electrical, and appliance repair: best-in-class organizations cluster near 88%, the broad average sits around 80%, and laggards trail near 63%, according to PTC’s field service research. Equipment complexity, parts logistics, and technician tenure all shift these numbers, so a company running highly specialized industrial repair work will benchmark differently than a residential HVAC operator.
| FTFR Band | Typical Range | Customer Satisfaction Signal |
|---|---|---|
| Best-in-class | ~88%+ | High retention, strong referral rates |
| Average | ~80% | Moderate satisfaction, some churn risk |
| Laggard | ~63% or below | Elevated complaints, higher churn |
The cost math is where this stops being abstract. PTC’s data shows that a missed first-time fix commonly triggers multiple additional dispatches, with each truck roll incurring significant labor, fuel, and overhead costs. Run that across a company doing hundreds of reactive jobs a month at a relatively low FTFR, the cost of avoidable rework can quickly mount to tens of thousands of dollars monthly, before you even count the technician hours that could have gone to billable revenue-generating work instead.
Why does this compound? FTFR improvements free technician capacity almost immediately, since every avoided callback is a slot that goes back on the schedule for a new paying job instead of a repeat trip. Field service teams that raise FTFR often reinvest that freed capacity into faster response times, which itself becomes a competitive advantage.
- Best-in-class operators reduce total dispatch volume, not just callback volume.
- Average performers have the most upside for a targeted 60-day improvement push.
- Laggards typically show a cluster of causes rather than a single fixable problem.
These benchmarks come from vendor research grounded in field service operations data across multiple trades, not a single self-reported survey, which is why the ranges hold up reasonably well across HVAC, plumbing, and electrical contractors alike.
What Causes Low First-Time Fix Rates?
Most callbacks trace back to a small handful of operational failures, and MSI Data’s analysis of field service operations identifies the same recurring culprits across trades.
- Missing parts. A technician arrives without the specific valve, capacitor, or fitting the job needs and has to reschedule. This is the single most common cause of repeat visits.
- Skill mismatch at dispatch. A generalist gets sent to a job that needed a specialist, so the diagnosis takes longer or the fix doesn’t hold.
- Poor diagnosis or triage at intake. The office books “AC not cooling” without asking follow-up questions, so the tech arrives without knowing whether it’s a refrigerant leak, a compressor failure, or a thermostat issue.
- Incomplete documentation. No service history means the technician re-diagnoses a problem that was already flagged on a prior visit.
- Appointment or access issues. Nobody’s home, the gate is locked, or the wrong unit gets serviced in a multi-unit building.
Each of these produces the same downstream effect: a second truck roll, a frustrated customer, and a technician hour that generated no new revenue.
Pro Tip: Build a mandatory closeout field that forces technicians to select a specific failure category, not a free-text note, whenever a job doesn’t resolve on the first visit. “Parts unavailable,” “wrong skill dispatched,” and “access denied” are actionable categories. “Complicated job” is not, and it’s what most techs will type if you let them.

How Can You Improve First-Time Fix Rate?
Raising FTFR comes down to fixing the conditions that set technicians up to fail before they even leave the shop. Here’s the priority order that tends to produce the fastest, most durable results.
- Skills-based dispatch. Match technician certifications and job history to the specific job type, not just availability. Owner: dispatch lead. Quick win: tag your top three most callback-prone job types and route them exclusively to certified techs for 30 days.
- Pre-dispatch kitting. Prepare a parts kit based on the diagnosed issue before the technician leaves for the site. Owner: warehouse or inventory manager. This directly targets the most common cause of repeat visits: missing parts.
- Real-time van inventory. Give dispatch visibility into what’s actually on each truck, not what’s supposed to be on it. Owner: operations manager. Long-term project, but it prevents dispatching a technician to a job the van can’t support.
- Structured triage at intake. Use a standardized question script when booking reactive calls so the technician arrives with a working diagnosis, not a guess. Owner: call center lead.
- Guided troubleshooting tools. Equip technicians with mobile checklists or diagnostic trees tied to equipment model numbers. Owner: field operations.
- Targeted training. Identify the specific job types dragging down the average and run focused refreshers, not generic skills training. Owner: training manager.
Prioritize by impact versus effort: pre-dispatch kitting and skills-based dispatch usually deliver the fastest lift for the least operational disruption, since they require coordinated changes to inventory management and job planning rather than a full system overhaul. Structured triage and guided troubleshooting take longer to embed into daily habits but compound over time.
- Reserve parts against a work order the moment the job is booked, not when the technician requests them.
- Send a pre-visit checklist to the customer confirming access, pets, and parking, cutting access-related delays.
- Run remote triage (photo or video) before dispatch on ambiguous calls to confirm the right technician and parts are sent.
How Does Software and AI Improve First-Time Fix Rate?
Field service software closes the gap between diagnosis and action, and the capabilities that move FTFR the most are specific, not abstract. Skills-based dispatching engines match job requirements to certified technicians automatically. Real-time inventory visibility shows dispatch exactly what’s on each van before a job gets assigned. Parts reservation ties inventory to a specific work order the moment it’s booked, so nothing gets pulled by another crew. Guided troubleshooting delivers equipment-specific diagnostic steps to a technician’s phone. Photo and video triage lets a customer submit images before the visit, so the technician can confirm parts and skill match in advance. Predictive maintenance signals flag likely failure points based on equipment age and service history, before the customer even calls.
Paperless workflows and offline-capable mobile tools reduce on-site guesswork by putting service manuals and part diagrams directly in a technician’s hands, which matters most for less-tenured techs who haven’t memorized every model variant yet.
A technician who arrives with the right part, the right skill certification, and the equipment’s service history already loaded isn’t performing a better diagnosis. They’re just not diagnosing blind.
Implementation example: Pick one capability, not five. Van inventory paired with parts reservation is the highest-leverage single pilot because it targets the most common failure cause directly. Run it with a subset of five to ten technicians for 30 to 60 days, track FTFR for that group against your baseline, and expand once you see measurable lift before rolling it company-wide. A free-form comparison of dispatch platforms can help you evaluate which system actually supports this workflow before committing.
How Do You Measure and Report FTFR Correctly?
Accurate FTFR reporting depends on consistent rules applied the same way every month, not judgment calls made fresh each time a job closes.
- Exclude planned multi-day installations and scheduled preventive maintenance visits with no reported fault.
- Count expedited part deliveries within 24 hours as a fix miss if they require a second technician visit.
- Require a minimum of 30 qualifying jobs per segment (technician, job type, or region) before reporting a percentage for that segment.
- Flag and review outlier technicians separately rather than folding them into a team average that masks the problem.
Watch these companion KPIs alongside FTFR so a single number never drives the whole conversation: truck-roll cost per job, technician utilization rate, SLA compliance percentage, and customer satisfaction or NPS scores. Organizations that push FTFR meaningfully higher tend to see the biggest satisfaction gains when the improvement is sustained, not a one-month spike.
Report FTFR monthly at the team level for operational adjustments, and quarterly at the technician and job-type level for training and staffing decisions. Slice by region if you operate across multiple markets, since parts logistics and technician tenure often vary enough to distort a single blended number.
Pro Tip: Build your FTFR dashboard to show trend lines, not just the current month’s percentage. A single bad month from one technician’s parole leave or a supplier delay shouldn’t trigger a company-wide policy change.
What Does a 30/60/90-Day FTFR Action Plan Look Like?
Turning this into results means sequencing changes instead of trying everything at once.
Days 1 to 30:
- Audit current FTFR by pulling the last 90 days of job data and calculating a true baseline, with exclusions applied correctly. Owner: operations manager. Metric to watch: baseline FTFR percentage by job type.
- Implement a mandatory pre-dispatch checklist covering parts, access, and skill match. Owner: dispatch lead. Metric: percentage of jobs with checklist completed before dispatch.
- Run a parts-availability audit on your top five highest-callback job types. Owner: inventory manager. Metric: parts-related callback count.
Days 31 to 60:
- Pilot skills-based dispatch for your two most callback-prone job categories. Owner: dispatch lead. Metric: FTFR for the piloted job types versus baseline.
- Add parts reservation tied to work orders for the pilot group. Owner: warehouse manager. Metric: percentage of jobs with reserved parts confirmed before technician departure.
- Start segmented FTFR reporting by technician and job type. Owner: operations manager. Metric: variance between highest and lowest performing segments.
Days 61 to 90:
- Expand the successful pilot practices to the full technician roster. Owner: operations manager. Metric: company-wide FTFR versus the day-1 baseline.
- Review closeout failure-category data to identify the next root cause to target. Owner: training manager. Metric: distribution of failure categories logged.
- Set a formal FTFR target for the next quarter based on pilot results. Owner: leadership. Metric: gap to best-in-class benchmark.
- Expect a modest FTFR lift within the first pilot window if parts and dispatch changes are implemented correctly.
- Expect the biggest early gains from the job types with the highest missing-parts rate, since that’s the fastest-closing gap.
- Expect resistance from technicians used to working around inventory gaps; address it with data, not mandates.
Where Do Field Teams Typically Get Stuck on FTFR?
The technical fixes for low FTFR are well understood: better parts logistics, skills-based dispatch, structured triage. What actually stalls most improvement efforts isn’t a lack of knowledge. It’s organizational friction that never shows up in a benchmark report.
The most common blocker is data living in silos. Dispatch software, inventory tracking, and technician performance records often sit in three different systems that don’t talk to each other, so nobody has a clean view of why a specific job failed on the first visit. A close second is ownership ambiguity: FTFR touches dispatch, inventory, training, and intake, and when a metric belongs to everyone, it tends to belong to no one. The third blocker is the daily pressure to just get the truck rolling. A dispatcher facing a full board and an angry customer will send whoever’s available, not whoever’s the best skill match, and that short-term instinct quietly erodes FTFR one job at a time.
The fix isn’t more training decks. It’s assigning a single owner for FTFR as a cross-functional metric, someone with visibility into dispatch, inventory, and technician performance data at once, and giving that person authority to slow down a dispatch decision when the data says a mismatch is likely. Leadership that treats FTFR as “the field team’s problem” instead of an organizational health indicator will keep chasing symptoms instead of causes.
How Can Jobospro Help Raise Your First-Time Fix Rate?
Every lever covered in this guide, from skills-based dispatch to real-time parts visibility, is exactly what Jobospro’s platform was built to run automatically instead of manually. Rather than juggling separate systems for scheduling, inventory, and customer communication, you get one operating layer that connects them and flags the gaps before a truck ever leaves the yard.
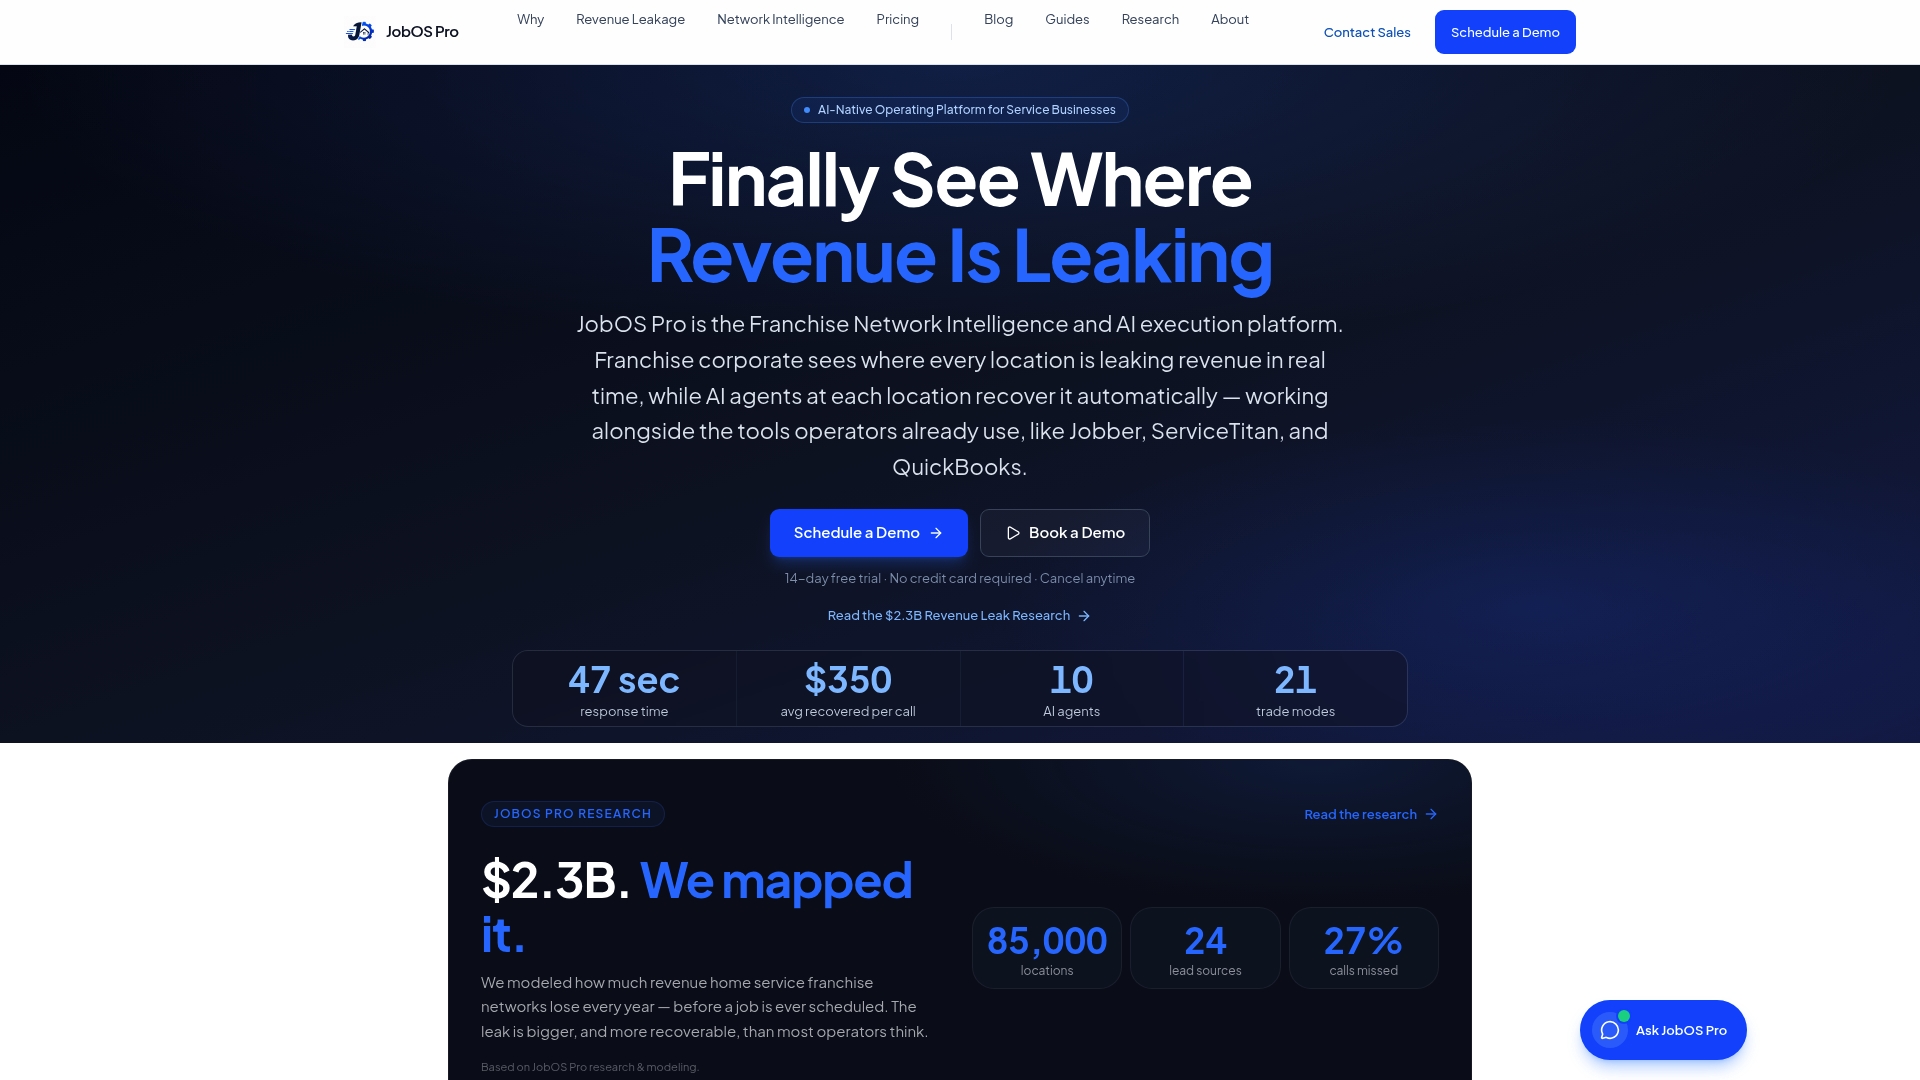
Here’s how the platform maps directly to what’s covered above:
- Skills-based dispatch board matches technician certifications and job history to incoming work automatically, cutting the mismatch problem covered earlier.
- Real-time inventory visibility shows what’s actually on each van, so dispatch stops sending technicians to jobs their trucks can’t support.
- AI receptionist handles structured intake so the triage details a technician needs arrive before the job is even booked.
- Predictive operational signals flag revenue leaks and scheduling risks, including the kind of dispatch mismatches that quietly drag down FTFR.
Franchise operators get an added layer here: multi-location benchmarking lets corporate leadership compare FTFR and related metrics across every location and standardize whichever practices are working best. You can explore the full platform on the features page, or see the broader case for AI-native operations on the why Jobospro page. If you’re ready to see how it applies to your own dispatch board, start a trial and pull your baseline FTFR into the platform within your first week.
Frequently Asked Questions
What is a good first-time fix rate?
How do you calculate first-time fix rate? Divide the number of jobs resolved on the technician’s first visit by the total number of qualifying service jobs, then multiply by 100. Exclude planned multi-visit installations and scheduled maintenance with no reported fault to keep the number accurate.
What’s the difference between FTFR and First Contact Resolution? FTFR measures whether a technician resolves an issue during an on-site visit, while First Contact Resolution measures whether the problem gets solved remotely, before a truck is ever dispatched. They track different stages of the service process.
What causes a low first-time fix rate? The most common causes are missing parts, mismatched technician skills, poor diagnosis at intake, incomplete documentation, and appointment or access issues. Missing parts is typically the single largest contributor.
How quickly can you improve first-time fix rate? A focused pilot on one high-leverage change, such as parts reservation combined with real-time van inventory, can show measurable lift within 30 to 60 days. Broader improvements from training and dispatch changes typically compound over a full quarter.
Sources
- What is First-Time Fix Rate (FTFR)? | IBM
- What is First-Time Fix Rate? | PTC
- First-Time Fix Rate (FTFR): Definition & How to Improve It