
Stop $2.3B in Losses With an Operations First Franchise KPI Dashboard
Stop $2.3B in Losses With an Operations First Franchise KPI Dashboard
A franchise KPI dashboard is a shared reporting system that pulls performance data from every location into one view so corporate teams and franchisees can act on it. The one outcome it has to deliver is network visibility paired with unit-level, actionable alerts tied to a real playbook. Industry KPI standards point to metrics like prime cost and labor percentage as the backbone of that view, and JobOS Pro’s own research found $2.3 billion in preventable revenue leakage across home service networks. A dashboard that doesn’t turn into next-day action isn’t a dashboard. It’s a report nobody reads.
TL;DR:
- To prevent revenue leakage, dashboards should focus on real-time alerts for missed calls, uncollected invoices, and scheduling gaps that can be addressed immediately.
- Effective dashboards combine financial, operational, customer, and compliance metrics in one view, tailored to each role to ensure relevance and actionability.
- Connecting automated data feeds from POS, accounting, and field apps with hourly refreshes improves data trustworthiness and speeds up issue detection.
- Alerts require clear thresholds, assigned ownership, and attached playbooks to convert notifications into prompt, targeted actions.
- Start with three key KPIs per role and gradually expand, ensuring franchisees regularly check and act on the dashboard without feeling scrutinized or overwhelmed.
Table of Contents
- Why a Franchise KPI Dashboard Matters for Multi-Location Networks
- Which KPI Categories Belong on a Franchise Dashboard?
- How Should You Design a Franchise Operations Dashboard?
- What Systems Should Feed Your Dashboard?
- How Do You Turn Dashboard Alerts Into Action?
- How JobOS Pro Applies These Principles in Practice
- What Mistakes Sink Most Franchise Dashboards?
- What Do Franchise-Specific KPIs Look Like by Industry?
- How Do You Keep Franchise Dashboard Data Trustworthy?
- Should Every Franchisee See the Same Dashboard?
- A Practical Note on Rolling Out Your Dashboard
- Evaluating JobOS Pro for Your Franchise Network
- Sources
- FAQ
Why a Franchise KPI Dashboard Matters for Multi-Location Networks
Running five locations off spreadsheets is annoying. Running fifty that way is dangerous. A franchise operations dashboard turns numbers that used to trickle in weeks late into signals your regional managers can act on the same day, and that shift changes what your headquarters actually does with its time.
Three things happen once a network adopts one properly:
- Revenue leaks (missed calls, uncollected invoices, scheduling gaps) surface fast enough to fix before they compound into a quarter-long slump.
- Brand standard enforcement stops depending on quarterly site visits and starts running on live compliance and audit scores.
- Support resources get triaged toward the locations that need coaching, instead of spread evenly across a network where half the units are already fine.
None of that works if franchisees feel watched instead of helped. Franchisee trust functions as a leading indicator itself: brands where franchisees trust corporate consistently beat their peers on operational benchmarks. Build the dashboard as a diagnostic tool, not a scoreboard for public shaming, and adoption follows naturally.
Which KPI Categories Belong on a Franchise Dashboard?
Franchise performance metrics fall into five buckets, and skipping any one of them leaves a blind spot corporate will eventually pay for.
- Financial KPIs. Track revenue by location and in aggregate, same-store sales growth, net margin, and prime cost, which combines cost of goods sold with labor. EBITDA margin belongs here too, since it’s the number most franchise valuations and Item 19 disclosures ultimately hinge on.
- Operational KPIs. Labor cost percentage, COGS percentage, throughput or RevPASH depending on the vertical, and schedule adherence. These move faster than financial results and often explain why margin is slipping before the income statement shows it.
- Customer KPIs. Net Promoter Score or CSAT, average ticket size, repeat customer rate, and customer acquisition cost. A location can hit revenue targets while quietly burning through its customer base with poor service. This category catches it.
- Training and compliance KPIs. Training module completion rates, field audit scores, and how fast corrective actions get closed out. These are the franchise field service KPIs that predict trouble before it shows up in a P&L.
- Context fields. Territory, operating hours, staff count, and whether a unit is even open on a given day. Without these, comparing a 24-hour urban location against a seasonal rural one produces garbage benchmarks.
Every one of these categories needs both a location-level view and a rolled-up network view. Effective franchise dashboards combine financial, operational, training, and compliance data in one place rather than scattering it across four disconnected reports nobody cross-references.
How Should You Design a Franchise Operations Dashboard?
Design decisions determine whether people actually open the dashboard or ignore it after week two. Four principles separate the ones that get used from the ones that get emailed and forgotten.
- Build role-specific views. A franchisor executive needs network-wide trendlines and outlier flags. A regional manager needs a shortlist of underperforming units in their territory. A franchisee needs their own numbers against relevant peers, nothing more. One dashboard, three defaults.
- Separate leading indicators from lagging ones. Training completion and audit scores move months before revenue does. Sales and margin confirm what already happened. Put leading indicators front and center so problems get caught while they’re still cheap to fix.
- Use anonymized benchmarking. Show a franchisee their percentile rank against the network average without naming the top and bottom performers publicly. It drives improvement without turning monthly calls into public shaming sessions.
- Attach every alert to a threshold and a playbook. An alert that says “labor cost is up” is noise. An alert that says “labor cost exceeded 32% for the third week running, here’s the coaching script” is a workflow.
Pro Tip: Cap your default dashboard view at five to seven KPIs per role. Franchisees who see thirty metrics on login tend to ignore all thirty; franchisees who see six tend to act on them.
What Systems Should Feed Your Dashboard?
A dashboard is only as good as the data flowing into it, and manual entry is where most franchise analytics tools quietly fail. The systems worth connecting include point-of-sale platforms, accounting software like QuickBooks, field audit and inspection apps, CRM systems, marketing analytics, and review or reputation platforms.
A few rules keep that data trustworthy once it’s flowing:
- Favor API or connector-based syncing with hourly refreshes over nightly batch jobs or, worse, manual spreadsheet uploads for anything tied to royalty calculations.
- Normalize how “revenue” is defined across every integrated system. Net versus gross revenue confusion is a leading cause of franchisee disputes at reconciliation time, and aligning those definitions up front speeds up month-end closing considerably.
- Map SKUs and categories consistently across POS systems if different locations run different point-of-sale versions.
- Align time windows precisely. A location on Central time reporting against a corporate rollup set to Eastern will misstate daily performance windows if nobody checks the offset.
For labor-heavy categories like landscaping or cleaning franchises, connecting scheduling and time clock data (tools like Heyhive handle GPS-based time tracking) closes the gap between what’s scheduled and what actually happened in the field, which is exactly where labor percentage KPIs tend to drift from plan.
How Do You Turn Dashboard Alerts Into Action?
A dashboard that flags a problem without a next step just adds another notification nobody reads. Every KPI on the board needs an owner, and every alert needs a service-level agreement for response time.
- Assign ownership. Someone specific, not “operations,” owns each KPI category and is accountable for responding when it crosses threshold.
- Attach a playbook to every alert type. A labor cost spike triggers a scheduling review. A training completion drop triggers a re-enrollment email and a manager check-in. An audit failure triggers a documented corrective action plan with a follow-up date.
- Recognize the wins, not just the misses. Leaderboards that highlight top-performing units by percentile (not raw revenue, which unfairly favors bigger territories) build the kind of buy-in that makes franchisees check the dashboard voluntarily.
- Send a one-page monthly flash report. Top three risks, top three wins, per unit. Keep it to one page. Dashboards connected to live field data resolve issues meaningfully faster than teams working off quarterly review cycles, and that speed compounds when everyone in the network is reading the same flash report on the same day each month.
How JobOS Pro Applies These Principles in Practice
JobOS Pro was built as an AI-native operating platform for home service franchise networks from day one, not bolted onto legacy field service software after the fact. It connects to tools franchisees already run, including QuickBooks, so corporate gets a rolled-up view without forcing every location through a system migration.
In practice, that looks like:
- Role-aware dashboards that give executives, regional managers, and franchisees the view relevant to their job, not a single generic report.
- Automated alerts for revenue leak signals like missed calls and uncollected payments, tied to a documented follow-up action rather than a raw number.
- Multi-location benchmarking that lets corporate spot which units are quietly falling behind before it shows up in quarterly financials.
The platform’s revenue leak research found $2.3 billion in preventable losses across home service businesses, largely from the exact gaps a well-built franchise operations dashboard is designed to catch.
What Mistakes Sink Most Franchise Dashboards?
The most common failure is dumping every available metric onto one screen. When a franchisee logs in and sees forty numbers with no hierarchy, they stop logging in. The fix isn’t a smarter interface. It’s fewer KPIs, chosen deliberately.
The second mistake is treating the dashboard as a compliance tool instead of a coaching tool. If the only time corporate references dashboard data is during a performance review or a default notice, franchisees learn to distrust the numbers and, eventually, to game them. Anonymized benchmarking exists precisely to avoid this trap.
Third, plenty of networks build dashboards around lagging indicators exclusively. Revenue, margin, and same-store sales all confirm what already happened. Leading indicators like training completion and audit results predict unit-level trouble months before it hits the P&L, and a dashboard that ignores them is always reacting late.
Fourth, data quality gets neglected until it causes a dispute. Manual spreadsheet entry, inconsistent revenue definitions across POS systems, and mismatched reporting periods between locations all produce numbers nobody trusts, and once trust in the data breaks, adoption of the whole system collapses with it.
Finally, some networks build one dashboard and never touch it again. Franchise systems evolve, new locations open, new products launch, and a dashboard frozen in its original design stops matching what the business actually needs to track within a year or two.
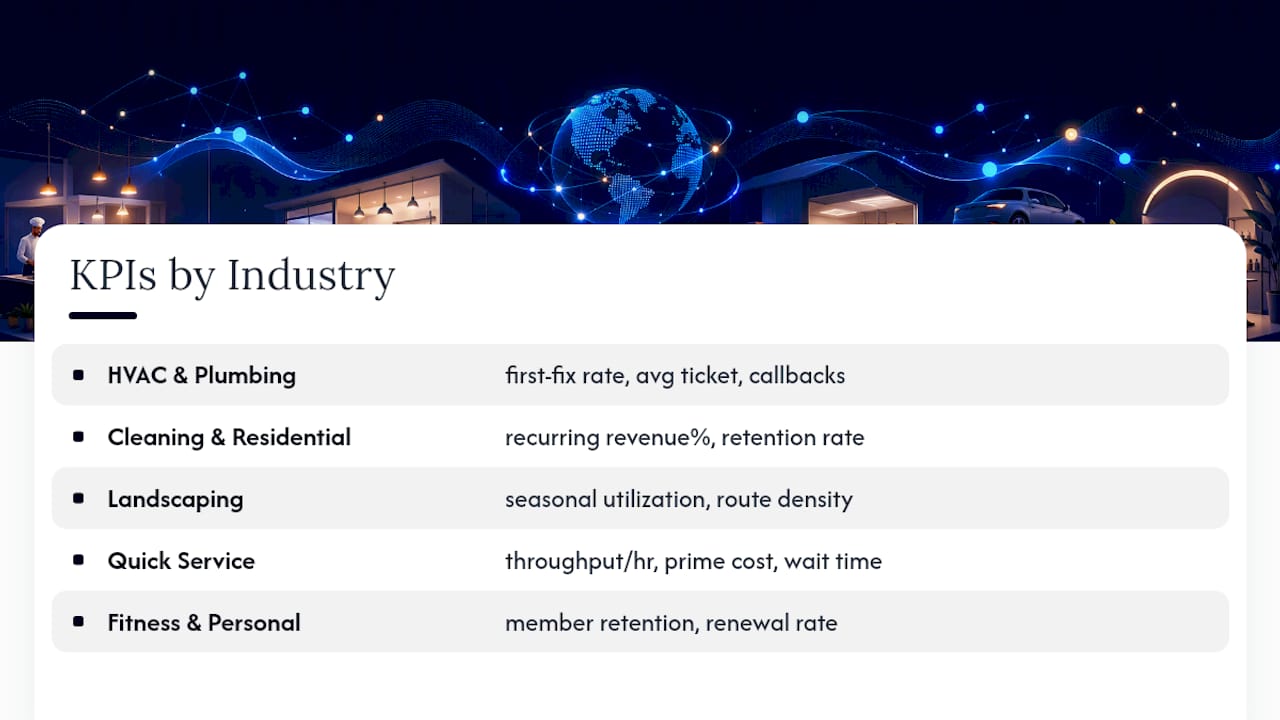
What Do Franchise-Specific KPIs Look Like by Industry?
Franchise performance metrics aren’t universal. What matters for an HVAC franchise looks nothing like what matters for a fitness studio, and treating every location type identically is its own design mistake.
For HVAC and plumbing franchises, the metrics that matter most are first-time fix rate, average ticket size, callback rate, and technician utilization. A dispatcher’s route efficiency shows up directly in labor cost percentage, which makes scheduling data one of the highest-value integrations for this vertical.
For cleaning and residential service franchises, recurring revenue percentage and customer retention rate tend to matter more than one-time job volume, since the business model runs on repeat contracts rather than single transactions.
For landscaping franchises, seasonal capacity utilization and route density carry more weight than they would elsewhere, since revenue swings hard by quarter and a dashboard that doesn’t account for seasonality will flag false alarms every winter.
For quick-service restaurant franchises, throughput per labor hour and prime cost dominate the conversation, alongside customer wait time as a proxy for both staffing adequacy and service quality.
For fitness and personal service franchises, member retention and renewal rate typically outrank one-time revenue metrics, because lifetime value is where the real margin lives.
The categories from earlier (financial, operational, customer, compliance) stay constant. The specific metrics inside each category should flex to match how the business actually makes money.
How Do You Keep Franchise Dashboard Data Trustworthy?
Data governance sounds like a back-office concern until a franchisee disputes their royalty calculation because two locations defined “net revenue” differently. At that point, it’s a trust problem, not a technical one.
Start by naming a single source of truth for each metric category. Revenue should have one accepted definition across every integrated POS system, and that definition should be documented somewhere every franchisee can check. The same goes for how refunds, discounts, and voided transactions get treated. If one location’s POS nets those out automatically and another reports them separately, your same-store sales comparisons are quietly broken.
Set a regular data audit cadence, not just an initial setup check. Systems change, franchisees switch point-of-sale providers, and integrations that worked fine at launch can silently break six months later without anyone noticing until a number looks strange.
Give someone explicit ownership of data quality, separate from whoever owns the KPI performance itself. That separation matters because the person accountable for a metric looking good shouldn’t also be the person who verifies the underlying data feeding it.
Finally, cross-check dashboard figures against disclosure-level data periodically. Item 19 and Item 20 of the Franchise Disclosure Document contain performance and outlet data that many franchisors don’t fully reconcile against their live operational feeds, and that gap is worth closing before a prospective franchisee or a regulator finds it first.
Should Every Franchisee See the Same Dashboard?
No. A franchisee running their fifth year with three locations needs a different default view than someone who signed six months ago and is still learning the systems. Treating both the same wastes the newer operator’s attention on metrics they can’t yet act on.
For new or ramping franchisees, keep the default view narrow: onboarding checklist completion, training module progress, and the two or three financial KPIs most predictive of early survival, like labor cost percentage and prime cost. Overloading a first-year operator with EBITDA nuance before they’ve stabilized staffing is a good way to make them stop checking the dashboard at all.
For established, high-performing units, shift the emphasis toward benchmarking against network percentiles and toward stretch goals rather than baseline compliance. These operators already have the fundamentals down. What motivates them is seeing how they rank against comparable units and where marginal gains are still available.
For underperforming units flagged by leading indicators, the dashboard should tighten around a specific improvement plan. Fewer KPIs, more frequent check-ins, and alerts calibrated to the exact issue identified in that unit’s corrective action plan.
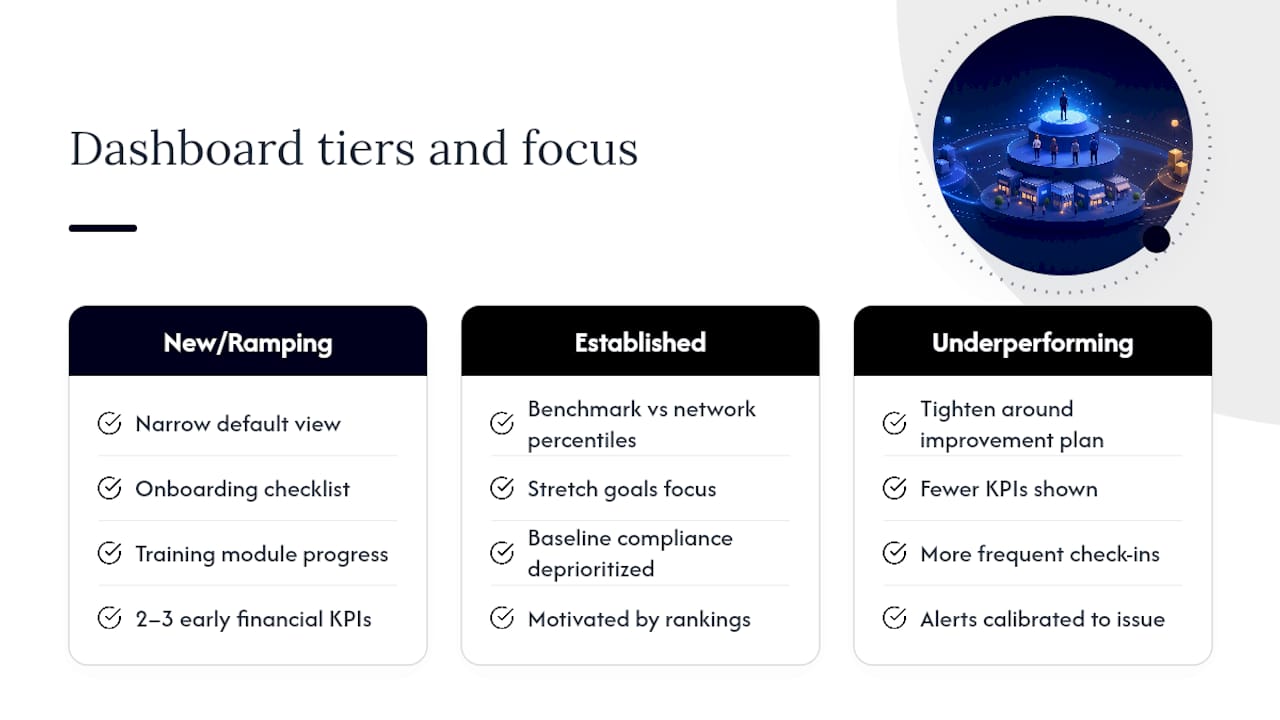
This tiering isn’t a one-time setup. Move a franchisee between tiers as their metrics change, and revisit the tier assignments at least quarterly so the dashboard keeps matching where the operator actually is, not where they started.
A Practical Note on Rolling Out Your Dashboard
Most franchise networks try to launch a dashboard with thirty KPIs live on day one, and most of those launches fail quietly within a few months. Start with three. Pick the three that predict the most trouble across your specific vertical, automate the data feeds for those three completely, and get franchisees checking them daily before adding anything else.
Use the dashboard for coaching conversations, never for gotcha moments. The fastest way to kill adoption is turning a monthly call into a public ranking exercise where the same three locations get called out every time. Rotate the framing toward what’s improving, not just what’s lagging.
One honest caveat: the specific thresholds and playbooks that work best vary by franchise system, and refining them takes a few reporting cycles of real data before they’re tuned correctly. Treat the first quarter as calibration, not verdict.
— Tarun
Evaluating JobOS Pro for Your Franchise Network
If you’re comparing tools, the gap that actually costs franchise networks money isn’t a missing chart. It’s the lag between a dashboard flagging a problem and someone acting on it. JobOS Pro closes that gap by pairing multi-location intelligence with automated alerts that trigger a specific playbook, not just a notification, and it does this while running alongside systems like QuickBooks that your locations already use.
When you sit down for a demo, push past the dashboard tour and ask about the mechanics that actually determine whether your team uses it: role-based views for executives versus regional managers versus franchisees, how quickly integrations sync (hourly beats nightly), whether benchmarking is anonymized, how alert thresholds get set, and what SLA workflow fires when an alert triggers. JobOS Pro’s franchise operations platform is built around exactly those mechanics, and plans start at $199 a month on the Starter tier, scaling up through Growth and Pro with custom Enterprise pricing for larger networks. If you’re running five or more locations without a dedicated ops manager at each one, the multi-location playbook is worth a look before your next demo call, and booking a demo directly lets you walk through your own franchise’s data instead of a generic template.
Sources
- 5 KPIs every franchisor dashboard needs — Qvinci
- Franchise performance benchmarks from 330 brands — Franchise Business Review
- Top KPIs You Should Track in Your Franchise Performance Dashboards — Claromentis
FAQ
What Are Examples of Good Franchise KPI Dashboards?
A strong example combines role-specific views, a narrow set of five to seven default KPIs per role, and alerts tied to documented playbooks rather than raw numbers. JobOS Pro’s franchise intelligence platform is built around this exact structure, pairing multi-location benchmarking with automated alerting.
What Are the 5 Main KPIs for a Franchise Dashboard?
The five most commonly cited franchise KPIs are revenue growth by location, EBITDA margin, labor cost percentage, prime cost, and same-store sales growth. Most networks layer customer and compliance metrics on top of these five as a second tier.
How Can I Create My Own Franchise KPI Dashboard?
Start by picking three leading-indicator KPIs specific to your vertical, connect your POS and accounting systems through API-based syncing rather than manual uploads, and build separate default views for executives, regional managers, and franchisees. Add anonymized benchmarking and alert thresholds once the core data feed is reliable, typically after one full reporting cycle.
How Many KPIs Should Be on a Franchise Dashboard?
Cap the default view at five to seven KPIs per role to avoid the overload that kills daily adoption. A full data warehouse can track dozens of metrics behind the scenes, but the screen a franchisee opens each morning should stay narrow and specific to what they can act on that day.