
30/90/180 Rollout: Multi Location Benchmarking for Franchise Operators
30/90/180 Rollout: Multi Location Benchmarking for Franchise Operators
Multi-location benchmarking is the practice of comparing standardized performance metrics across every site in your network to spot underperformers, isolate what your best locations do differently, and scale it. The single action to start with today: agree on 6 to 8 core KPIs with your ops team, then publish a weekly scorecard for every location using those same definitions. Everything else, the peer clusters, the data integrations, the remediation playbooks, builds on that one habit.
TL;DR:
- Benchmarking should compare each location against peer clusters and internal top performers, not just isolated metrics, to identify real operational gaps.
- Using a limited set of 6 to 8 standardized KPIs ensures trustworthiness and actionable insights, avoiding information overload.
- Regular automation of comparisons and real-time data feeds is essential to catch issues early and prevent performance drift.
- Regional market differences require adjusting benchmarks for local demand, wage laws, and customer expectations to maintain credibility.
Table of Contents
- What Makes Multi-Location Benchmarking Different From Single-Site KPIs
- The KPIs Every Location Should Report the Same Way
- How Do You Fairly Compare Different Locations?
- What Should Each Reporting Tier Actually Show?
- How Do You Spot an Underperforming Location Early?
- Running Benchmark Comparisons and Automating the Follow-Up
- Your 30/90/180-Day Rollout Plan
- Do Regional and Cultural Differences Skew Your Benchmarks?
- What Privacy Rules Apply When You Aggregate Multi-Site Data?
- Can Predictive Analytics Improve Your Benchmarking Program?
- Why Disciplined Benchmarking Is the Real Operational Advantage
- How JobOS Pro Puts Benchmarking Into Daily Operations
- Where to Read More on Multi-Location Benchmarking
- Sources
- FAQ
What Makes Multi-Location Benchmarking Different From Single-Site KPIs
A single location tracks its own revenue against its own history. Multi-location benchmarking asks a harder question: how does Store 14 perform against Store 22, and against the network median, once you strip out the noise of different rents, staffing levels, and local demand?
That distinction changes how you build every metric. A revenue number that looks strong in isolation might be mediocre once you compare it to three similar-format sites in the same region. Operators who skip this step often keep a weak location afloat for years because nobody ever ran the comparison. Franchise systems that treat benchmarking as core operating discipline, not a quarterly reporting chore, consistently outperform: top-quartile brands beat lower-ranked peers by 67% to 100% across critical operational areas, and their franchisee satisfaction scores run significantly higher.
The gap usually isn’t marketing spend. It’s delivery, governance and execution discipline that benchmarking exposes long before a P&L statement would.
The KPIs Every Location Should Report the Same Way
Metric bloat kills benchmarking programs. Managers stop trusting a scorecard with 40 fields, so pick a compact set and hold every site to the same definitions. Recommended core KPIs for a franchise or multi-site network include:
- Unit revenue — the base figure everything else is measured against.
- Unit EBITDA margin — the real profitability signal, not top-line revenue.
- Same-store sales (SSS) — growth measured against the same site’s prior period, filtering out new-location noise.
- Revenue per labor hour — how efficiently a crew converts hours into dollars.
- Labor % — a variance here should trigger an immediate schedule audit, not a shrug.
- NPS or CSAT — customer sentiment, tracked at a scale you can actually compare across sites.
- Quality audit score — the operational compliance check that predicts problems before they show up in revenue.
- Customer return/repeat rate — a leading indicator that often moves before revenue does.
Start with 6 to 8 of these. Adding more feels thorough, but it usually just buries the two or three numbers that actually move decisions.
How Do You Fairly Compare Different Locations?
Comparing raw numbers across dissimilar sites produces false alarms. A four-layer method solves most of the fairness problem.
- Baseline each location against itself. Track a rolling 8 to 13 week window so you catch drift early, before a bad month becomes a bad quarter.
- Build peer clusters. Group 3 to 6 similar locations by format, market size, or demographic profile so you’re comparing apples to apples, not a flagship downtown store to a satellite drive-through.
- Use your best internal location as the operational target. External industry benchmarks tell you where you stand in the market; your own top performer tells you what’s operationally possible right now.
- Choose the right benchmark type for the question. Average benchmarks smooth out noise across a large group. Median benchmarks resist distortion from one outlier location. Feature benchmarks compare against a single reference site you designate. The Benchmark Comparisons workflow supports all three and lets you add percent-difference fields directly to your output table.
Networks with diverse formats need one more layer: role-based comparison, defining 2 to 4 archetypes like flagship, urban, suburban, and satellite, so a healthy low-volume site never gets flagged as a failure just because it’s a different kind of store.
What Should Each Reporting Tier Actually Show?
A single dashboard trying to serve a location manager and a board member fails both audiences. Tier your reporting instead.
- Tier 1, weekly, location manager: 5 to 8 KPIs they directly control, with red/yellow/green triggers that flag a problem the moment it appears.
- Tier 2, weekly, ops leadership: a portfolio dashboard with a ranked composite score and leaderboards, so regional managers see where attention is needed across their whole territory.
- Tier 3, monthly, executive: unit EBITDA trends, same-store sales trajectory, and the capital allocation decisions those numbers justify.
- Tier 4, quarterly, board or investor: a rollup that ties operational performance to portfolio-level financial results.
Each tier should own its own review cadence. A location manager checking a board-level report weekly is looking at numbers too lagged to act on; an executive digging into daily location noise is wasting time that belongs on strategy.
How Do You Spot an Underperforming Location Early?
Three signals matter: a location sitting as a statistical outlier against its peer cluster, a site running consistently below its own rolling baseline, or a negative trajectory that’s accelerating rather than leveling off.
Once flagged, run this sequence:
- Verify the data first. Confirm cost allocation, traffic mix, and any recent operational changes before assuming the location itself is the problem.
- Assign a single owner. One person accountable for the fix, not a committee.
- Pick one corrective action. Resist the urge to change five things at once; you’ll never know what actually worked.
- Test for 30 days, then document the result. Escalate to regional leadership only if the metric hasn’t moved.
Pro Tip: Keep every remediation test and its outcome in a single running log per location. When a buyer or investor eventually asks why a site underperformed and how you fixed it, that log is your answer.
If a sale or investment round is on the horizon, buyers will disaggregate every location’s P&L during diligence and expect 18 to 24 months of consistently allocated history. Inconsistent allocation is one of the fastest ways to depress a valuation.
Running Benchmark Comparisons and Automating the Follow-Up
Methodology only pays off once it runs on a schedule instead of a spreadsheet someone rebuilds every month. A practical workflow looks like this:
- Select the sites you want compared.
- Choose your benchmark type: average, median, or a specific feature location.
- Add the attributes that matter (revenue, labor %, EBITDA margin).
- Run the comparison and pivot the results table by region, format, or manager.
- Export percent-difference fields so every location’s gap from benchmark is a number, not a guess.
Without near-real-time data connectors, a struggling site can drift for weeks before anyone notices, since automation and daily P&L feeds materially shorten the gap between signal and action.
A revenue-leak study covering $2.3 billion across home service networks found that missed calls, uncollected payments, and scheduling delays quietly drain margin at the location level, often invisibly until benchmarking surfaces the pattern.
This is exactly the gap JobOS Pro’s franchise intelligence system is built to close: connecting POS, dispatch, and accounting data into automated location scorecards, leaderboards, and exportable comparison tables, with AI agents flagging leaks and standardizing winning behaviors network-wide.
Your 30/90/180-Day Rollout Plan
- First 30 days: align on KPI definitions across every location, pilot the program on a 1 to 3 site cluster, and connect your core data sources (POS, labor, accounting).
- By 90 days: expand to full peer clusters, automate exports and alert triggers, and run your first documented 30 day remediation tests on flagged sites.
- By 180 days: full tiered dashboards live, cost allocation history documented and consistent, and monthly executive reviews established as a standing calendar item.
Track completion rate of KPI standardization at day 30, number of remediation tests closed at day 90, and executive review adoption at day 180 as your proof points.
Do Regional and Cultural Differences Skew Your Benchmarks?
Yes, and ignoring this is one of the most common ways a benchmarking program loses credibility with the field. A location in a dense urban market with high foot traffic and a location in a rural service territory that runs entirely on scheduled dispatch are not the same business, even under the same brand.
Labor costs vary by region for reasons that have nothing to do with management quality. Minimum wage laws, local competition for skilled technicians, and even seasonal demand swings (snow removal in the Midwest, pest control in the Gulf Coast) all shift the baseline a location should be measured against. Comparing a Phoenix HVAC franchise’s summer numbers to a Minneapolis location’s summer numbers without adjusting for climate-driven demand produces a meaningless gap.
Customer expectations shift regionally too. NPS benchmarks that look strong in one market might reflect a different cultural baseline for politeness or complaint behavior in another. A location scoring lower on CSAT isn’t necessarily underperforming; it might be operating in a market where customers rate everything more conservatively.
The fix is the peer clustering approach covered earlier, but applied with regional context in mind. Group locations by market type first, then by format. A Southeast suburban store should sit in a cluster with other Southeast suburban stores, not get benchmarked against a Northeast urban flagship just because both carry the same brand name. Franchisors who build regional context into their clusters catch real performance gaps instead of geographic artifacts.
What Privacy Rules Apply When You Aggregate Multi-Site Data?
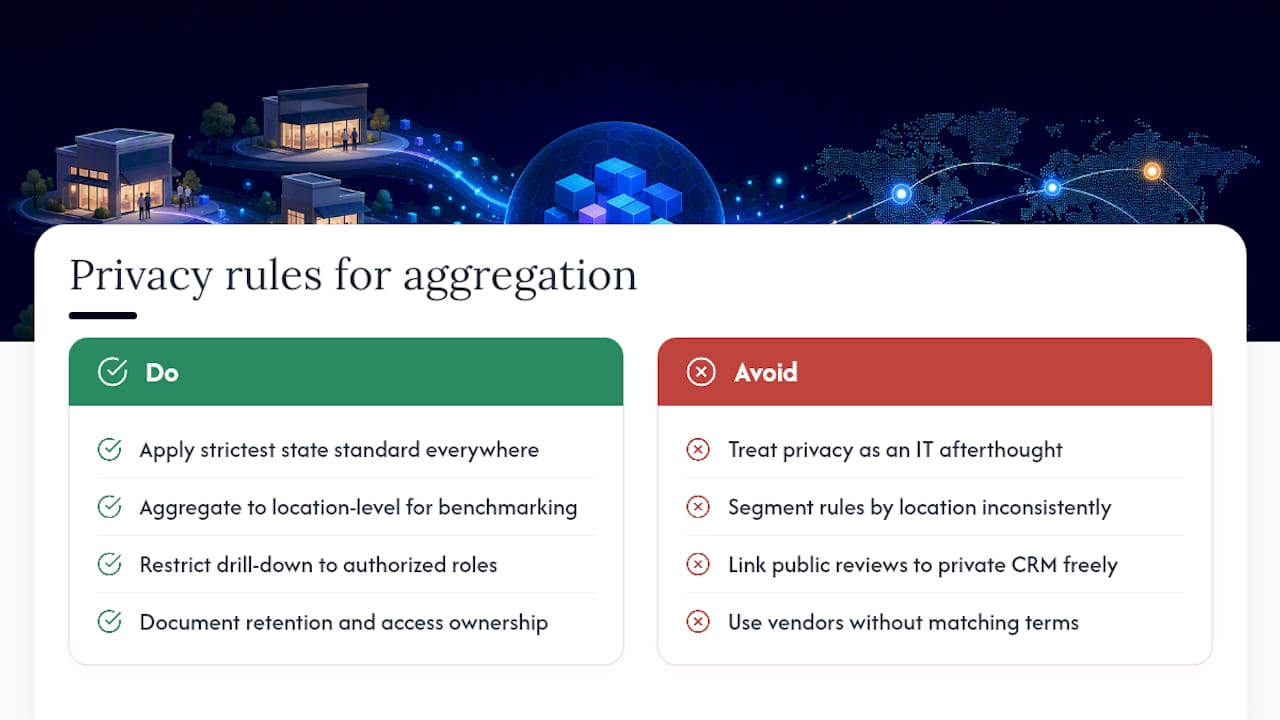
Pulling customer, employee, and transaction data from dozens of locations into one benchmarking system raises real compliance questions, and franchise operators can’t treat this as an IT afterthought.
Customer data, especially anything tied to payment information, names, or contact details pulled from CRM and dispatch systems, needs to be handled under whatever data protection framework applies to your states of operation. If your network spans states with different consumer privacy statutes, the aggregation layer should apply the strictest applicable standard across the board rather than trying to segment rules location by location, which invites errors.
Employee data carries its own sensitivity. Labor hours, scheduling data, and performance scores tied to individual technicians or managers should be access-controlled so only the people with a legitimate operational reason, a regional manager, not every corporate analyst, can see individual-level detail. Aggregate the data to the location level for broad benchmarking and restrict drill-down to named individuals.
Review and reputation data pulled from public platforms is generally lower risk since it’s already public, but be careful about how you store and cross-reference it with internal customer records. Combining a public review with a private CRM record to identify a specific customer’s complaint history creates a linkage that carries more privacy weight than either data set alone.
Document your data retention policy and who owns access at each tier. If your benchmarking platform integrates with third-party tools, confirm each vendor’s data handling terms match your own commitments to franchisees and customers, since a breach at any connected point becomes your liability too.
Can Predictive Analytics Improve Your Benchmarking Program?
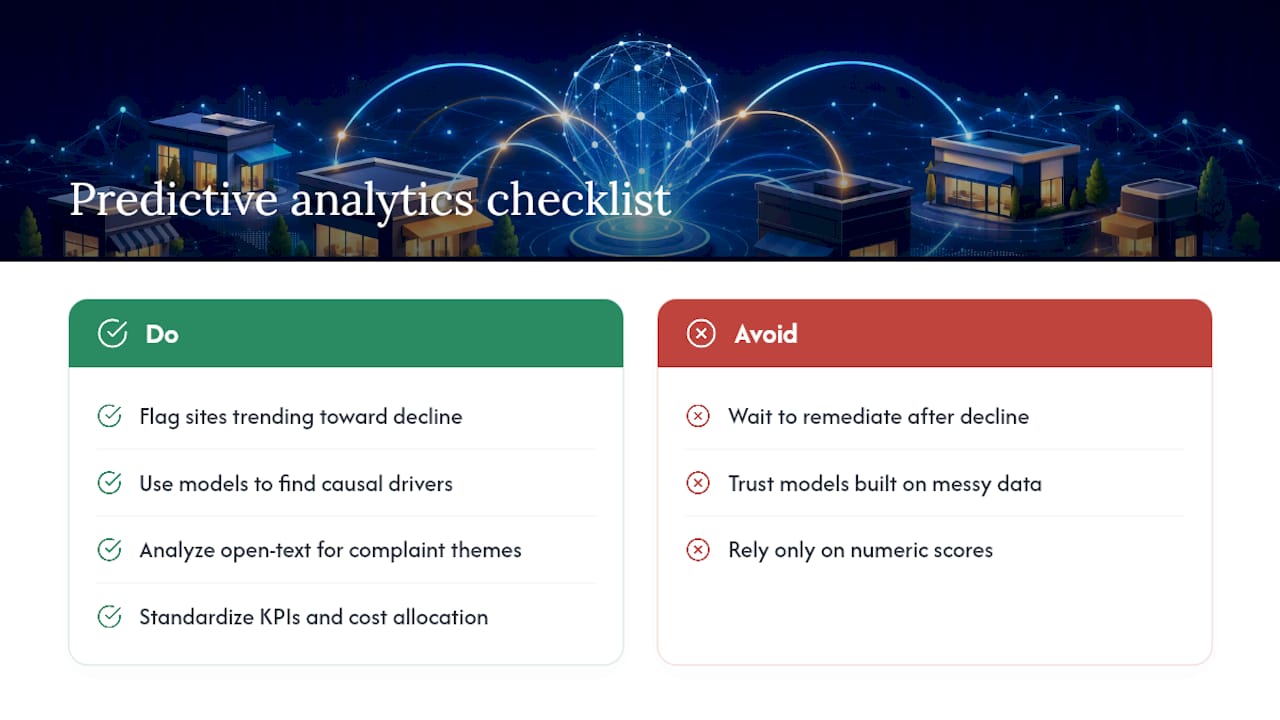
Static benchmarking tells you where a location stands today. Predictive analytics tells you where it’s headed, and that shift changes remediation from reactive to preventive.
The most useful application for multi-location operators is trajectory forecasting: instead of just flagging a site that’s below baseline right now, a predictive model can flag a site that’s on pace to fall below baseline in six weeks based on its current rate of decline. That gives a regional manager time to intervene before the numbers turn into a real problem, rather than after.
Machine learning models also help isolate which variables actually predict underperformance, separating causation from coincidence. A location might show falling revenue at the same time three other metrics shift, but a model trained across your full network can identify which of those changes is actually driving the decline versus which one is just noise. That’s a harder distinction to make by eye across 40 locations reporting weekly numbers.
Sentiment analysis applied to open-text customer feedback adds another layer. Rather than relying on a numeric NPS or CSAT score alone, natural language models can flag recurring complaint themes (slow dispatch times, billing confusion, rescheduling friction) faster than a manual review of comment cards ever could, giving you a root cause instead of just a declining score.
None of this replaces the fundamentals covered earlier. A predictive model built on inconsistent cost allocation or mismatched KPI definitions just produces confident wrong answers faster. Get the baseline, peer cluster, and data standardization right first; layer prediction on top once the foundation holds.
Why Disciplined Benchmarking Is the Real Operational Advantage
The data backs up what field experience already suggests: top-quartile franchise systems aren’t winning through bigger budgets. They win through disciplined delivery, and benchmarking is how you catch the gap between a location that’s coasting and one that’s actually excelling before it shows up in annual numbers.
Most networks I’ve studied treat benchmarking as a report, not a habit. The ones that outperform treat it as a weekly conversation between location managers and ops leadership, with clear ownership on every flagged metric. Cadence and follow-through beat any dashboard sophistication.
— Tarun
How JobOS Pro Puts Benchmarking Into Daily Operations
Jobospro is the operating layer that turns everything above from a spreadsheet exercise into a running system. Instead of manually pulling numbers from your POS, scheduling software, and accounting platform every week, JobOS Pro connects those systems directly, feeding automated location scorecards and leaderboards that update on their own.
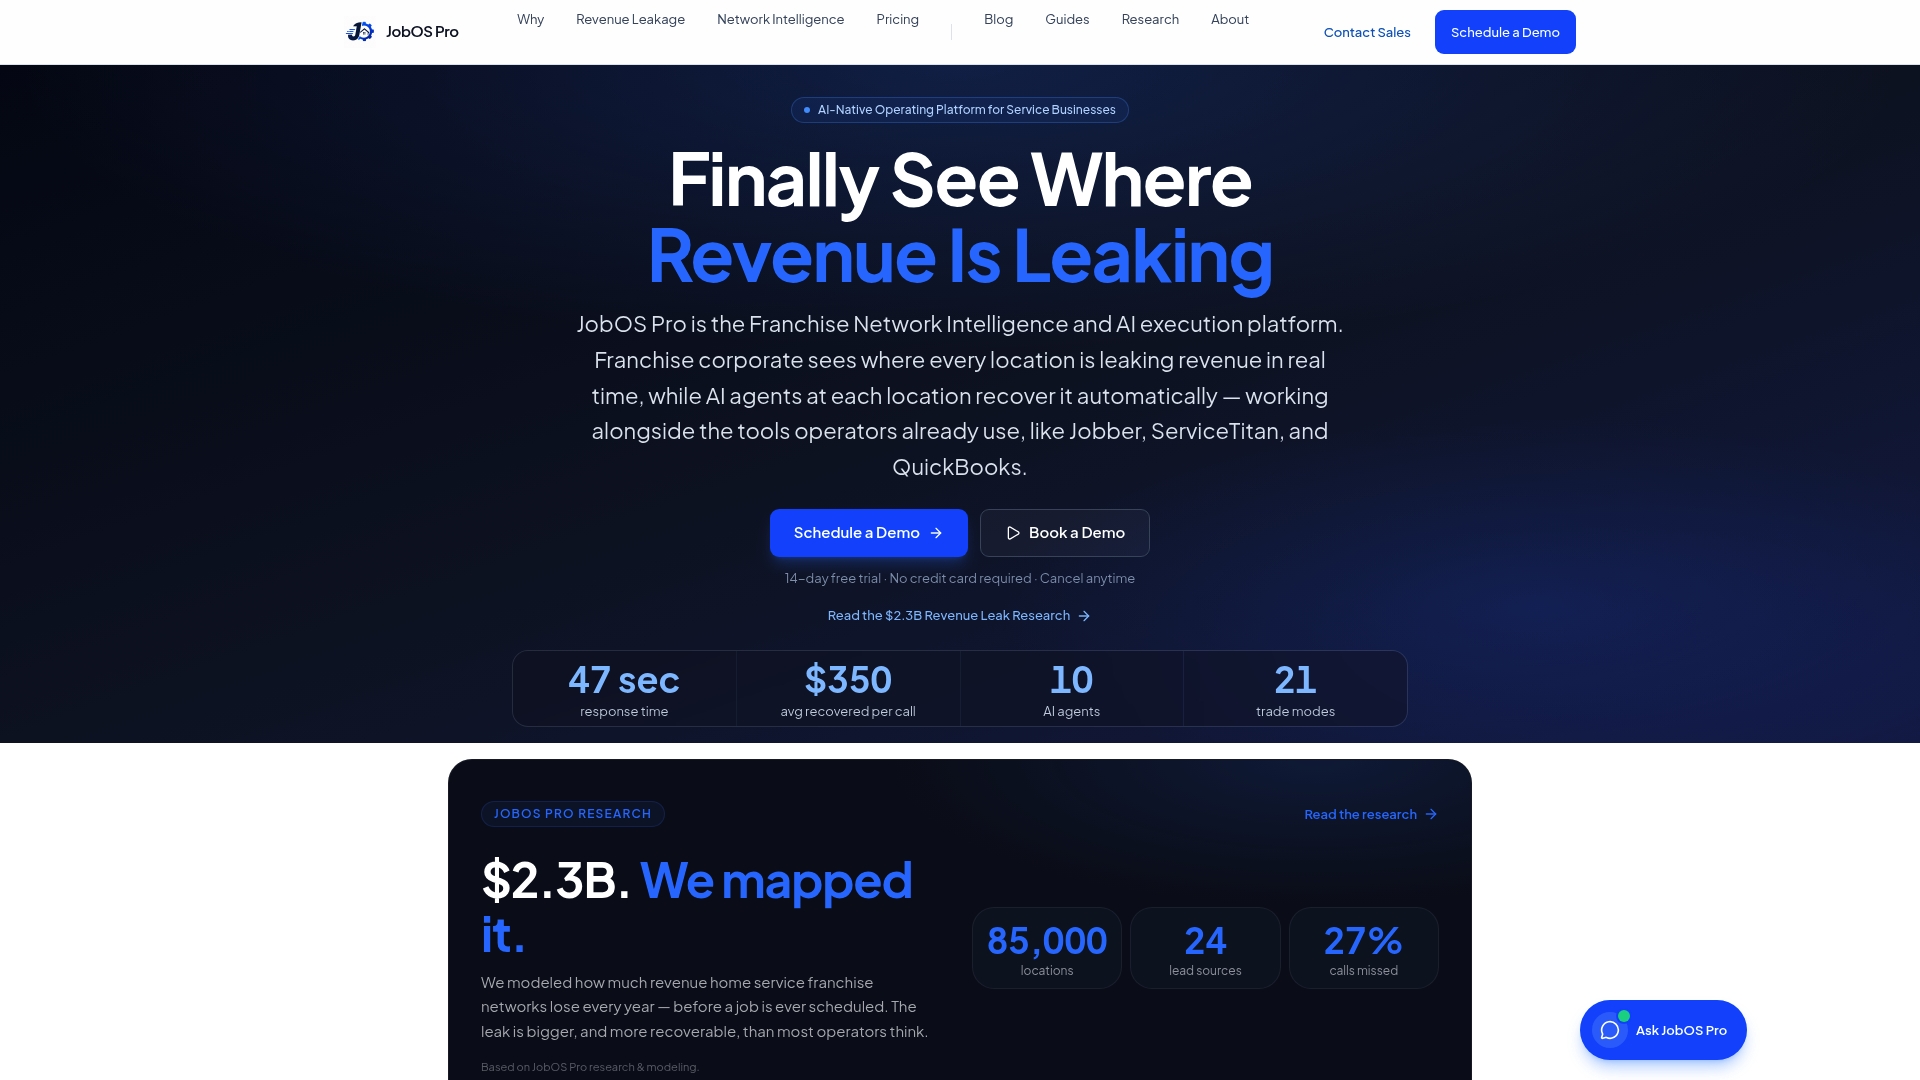
The platform’s AI agents watch for common operational signals like labor % variance, changes in revenue per labor hour, and shifts in customer sentiment, surfacing them to managers promptly. For franchise networks specifically, multi-location intelligence standardizes winning behaviors across sites automatically instead of relying on someone remembering to check the numbers manually.
This platform can run alongside commonly used tools rather than forcing a migration. Plans start at $199 per month for the Starter tier and scale to $549 per month for Pro, with custom Enterprise pricing for larger franchise networks. If you’re managing more than a handful of locations, book a demo and see what your own scorecard would look like running live.
Where to Read More on Multi-Location Benchmarking
For deeper detail beyond this guide, Franchise Business Review’s 330-brand analysis breaks down what separates top-quartile franchise systems. The Benchmark Comparisons documentation covers the technical workflow step by step, and Chattermill’s CX benchmarking guide goes deeper into normalizing customer feedback across sites.
Sources
Benchmarking is only as good as the data feeding it, and most networks run on systems that were never designed to talk to each other. Connect your point-of-sale system, workforce scheduling software, CRM or dispatch platform, inventory management, accounting software, and review aggregation tools before you build a single scorecard.
Before any comparison runs, lock down a shared definition checklist:
- Franchise Performance Benchmarks: A Breakdown of 330 Brands
- Benchmark Comparisons (ArcGIS Pro documentation)
- Multi-Location Performance Benchmarking: How to Identify Underperformers Before a Buyer Does
- Multi-Location Business KPIs: What It Is, Why It Matters
Pro Tip: Run a one-week audit where every location manager reports the same five numbers manually, then compare those figures to what your systems generated automatically. Any mismatch reveals a definition gap before it corrupts a quarter of comparisons.
The most common failure points are mismatched reporting cadences between systems, inconsistent cost allocation across sites, and customer experience scores pulled from too small a sample. Effective CX benchmarking normalizes for response volume so a location with 12 reviews isn’t compared directly against one with 400.
FAQ
What Are the Five Phases of Benchmarking?
Most frameworks describe planning (defining what to measure and why), data collection, analysis (comparing against baselines and peers), action (remediation or scaling), and monitoring (tracking whether the change worked). In a multi-location context, that monitoring phase is what most operators skip, and it’s the one that turns a one-time fix into a repeatable improvement.
How Do You Handle Local SEO for Multiple Locations?
Each location needs its own consistent business listing across major citation sites, matching name, address, and phone number exactly, since mismatched listings confuse both customers and search engines. A priority list of local citation sites is a practical starting point, and pairing that with centralized review management keeps reputation signals consistent across every site.
What Is Multi-Location Inventory Management?
It’s the practice of tracking stock levels, reorder points, and turnover rates separately for each site while comparing those figures across the network to spot waste or shortages. For service businesses, this often extends to parts and equipment inventory tied directly to dispatch and scheduling data.
Can You Give an Example of Location-Based Data?
Revenue per labor hour at a specific store, that store’s NPS score for the month, or its labor cost percentage against its own rolling baseline are all location-based data points. Each becomes meaningful for benchmarking only once it’s compared against a peer cluster or the network median using consistent definitions.
What Does JobOS Pro Cost for a Franchise Network?
JobOS Pro’s published plans run from $199 per month (Starter) to $549 per month (Pro), with custom Enterprise pricing for larger franchise networks available on the pricing page.