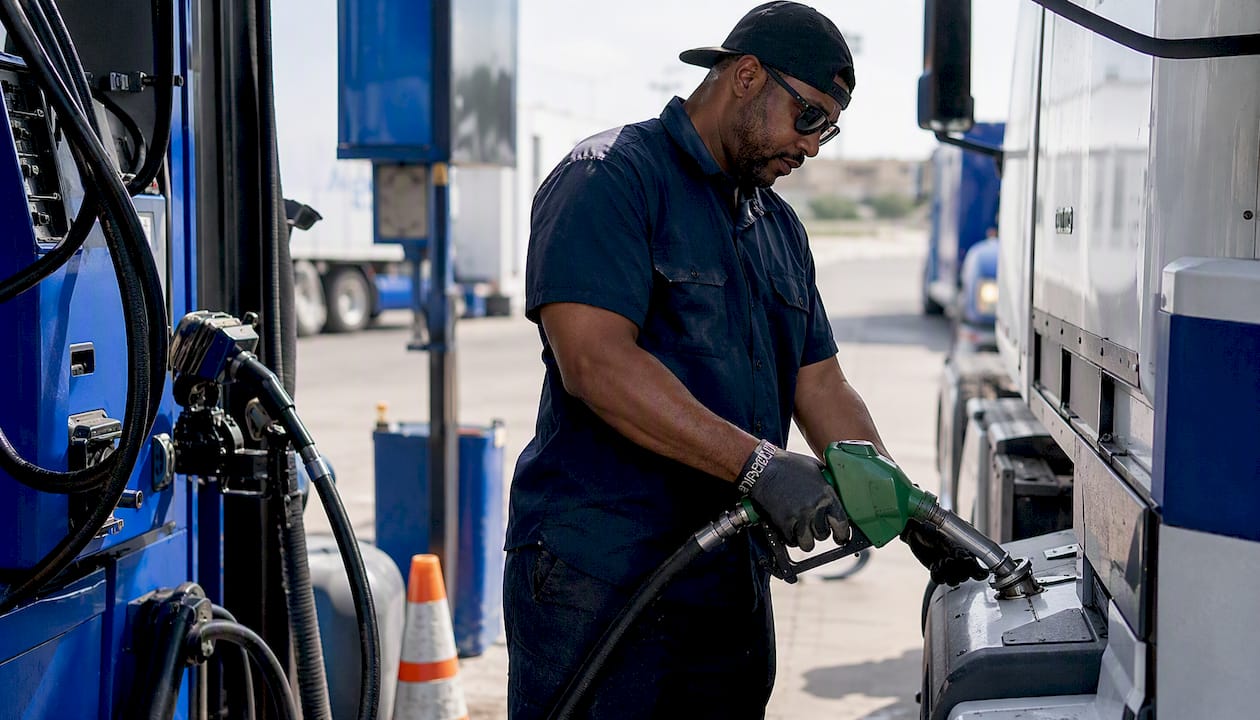
How to Reduce Fleet Fuel Costs: A Practical Guide
How to Reduce Fleet Fuel Costs: A Practical Guide
The fastest way to reduce fleet fuel costs is to attack five levers simultaneously: telematics visibility, driver behavior enforcement, route optimization, right-spec vehicles, and procurement controls. Fleets that treat these as an integrated system rather than isolated fixes typically see 10–20% MPG improvement within the first 90 days. This pattern commonly appears across disciplined programs.
Your highest-impact moves, ranked by speed of return:
- Fastest wins (Days 1–14): Activate fuel card controls, run a tire-pressure audit, and pull a 14-day baseline of MPG by driver and route.
- Mid-term moves (Days 15–60): Coach the bottom quartile of drivers on speed and idling, pilot time-aware routing on your busiest corridors, and install telematics rules for idle alerts.
- Highest-return investments (Days 61–90+): Right-size or re-spec your worst-performing assets, renegotiate fuel supplier contracts, and evaluate APUs for vehicles that idle more than two hours daily.
Fuel stat: Industry data shows most fleets see 10–15% fuel reduction within the first year after implementing professional telematics combined with enforcement and coaching.
Start with a 14-day baseline measurement before you change anything. You cannot coach, route, or procure your way to savings without knowing where the waste actually lives.
Key Takeaways
The fastest, most durable way to cut fleet fuel spend is to combine telematics visibility with driver coaching, route optimization, and right-spec vehicles — treating fuel efficiency as an integrated operational system, not a series of one-off fixes.
| Point | Details |
|---|---|
| Run a 14-day baseline first | Rank vehicles and drivers by fuel cost per mile before changing anything. |
| Coaching drives 40%+ of savings | Systematic driver coaching on speed, idling, and acceleration accounts for a large share of realized fuel improvements. |
| Idling costs ~1 gallon/hour | Heavy-duty diesel idle burn adds up to hundreds of gallons per vehicle annually; a five-minute idle policy pays back fast. |
| Right-spec beats behavioral fixes | Matching vehicle spec to duty cycle removes waste at the source and compounds over the vehicle’s lifetime. |
| Jobospro centralizes the data | Jobospro’s AI-native platform connects routing, truck inventory, and driver scorecards to accelerate fuel savings for home service fleets. |
Table of Contents
- What KPIs and data do you need to reduce fleet fuel costs?
- How does route planning cut miles and fuel use?
- How do driver behavior and coaching programs cut fuel waste?
- What maintenance and vehicle specs reduce fuel consumption?
- How much fuel does idling waste, and how do you stop it?
- What fuel procurement strategies lower your pump costs?
- How do you convert fuel savings into dollars for leadership?
- What does a 30/60/90-day fuel reduction plan look like?
- What does the research actually show about fuel savings?
- How do eco-driving training programs work in practice?
- How does predictive maintenance prevent fuel-wasting breakdowns?
- How does cargo management reduce fuel use through weight control?
- How do you benchmark your fleet’s fuel consumption against industry standards?
- How should fuel costs factor into fleet replacement and expansion decisions?
- What alternative fuels and vehicle types should you consider?
- What operators actually get wrong about sustaining fuel programs
- Jobospro gives home service fleets a faster path to fuel savings
- Sources
What KPIs and data do you need to reduce fleet fuel costs?
You need five data streams before any program makes sense: odometer readings, fuel card transactions, telematics-derived engine metrics, vehicle spec and gross vehicle weight (GVW), and duty-cycle records. Missing even one of these creates blind spots that let waste hide.
The minimum KPI set every fleet manager should track:
- Miles per gallon (MPG) by driver and by route — separates vehicle problems from behavior problems.
- Fuel cost per mile — normalizes spend across different vehicle classes.
- Idle percentage — total idle hours divided by total engine hours, expressed as a percent.
- Unauthorized fuel events — transactions outside approved time windows, locations, or gallon limits.
- MPG trend by vehicle age — flags mechanical degradation before it becomes a breakdown.
The 14-day baseline audit: Pull fuel card transactions and match them to telematics odometer data for every vehicle. Rank vehicles by fuel cost per mile. Rank drivers by idle percentage and average speed on highway segments. This single exercise typically surfaces two or three high-cost outliers that account for a disproportionate share of total spend.
- Export fuel card data for the past 30 days.
- Cross-reference each transaction against telematics GPS timestamps and odometer readings.
- Flag any transaction where the vehicle was not at the pump location (telematics GPS vs. card swipe location mismatch).
- Calculate MPG per vehicle: miles driven divided by gallons purchased.
- Rank all vehicles and all drivers; identify the bottom quartile in each list.
Pro Tip: Integrating your fuel card platform directly with your telematics system creates automatic cross-checks. Geotab’s research shows that fuel cards enforced with telematics data materially reduce unauthorized purchases and give you the transaction-level visibility needed to audit spend accurately.
How does route planning cut miles and fuel use?
Distance-only routing picks the shortest path. Time-aware, traffic-aware routing picks the path that burns the least fuel — and those two paths are often different. Avoiding a congested corridor at 8 AM can save 15 minutes of stop-and-go driving, which hits fuel economy harder than highway miles. AI-powered routing can cut 10–25% of fuel waste by optimizing stop sequencing, avoiding congestion, and reducing empty miles.
Practical dispatch tactics that deliver immediate savings:
- Stop sequencing: Order stops to minimize backtracking and left turns (UPS-style right-turn routing reduces idle time at intersections).
- Appointment clustering: Group jobs within the same geographic zone on the same day rather than sending a truck across town twice.
- Time-of-day avoidance: Schedule highway runs before 7 AM or after 6 PM where possible.
- Load matching: Assign the right vehicle size to each job — sending a 3/4-ton truck on a job that needs a cargo van wastes payload capacity and fuel.
- Single-trip consolidation: Combine supply pickups with job routes rather than running separate supply runs.
Track three metrics to confirm routing improvements are working: miles per job, deadhead miles as a percentage of total miles, and route MPG trend week over week.
Pro Tip: Pair your field service scheduling process with traffic-aware dispatch software. A dispatcher who manually sequences stops based on geography alone will consistently underperform an algorithm that factors in real-time traffic, job duration, and vehicle type.
Routing stat: Disciplined route optimization programs consistently deliver 10–25% reductions in wasted miles — one of the fastest-returning levers in any fuel reduction program.
How do driver behavior and coaching programs cut fuel waste?
Aggressive driving reduces fuel economy by roughly 15–30% at highway speeds and 10–40% in stop-and-go traffic.
The four behaviors that matter most, in order of fuel impact:
- Speed management: Every 5 mph over 50 mph costs the equivalent of $0.24–$0.29 per gallon in additional fuel.
- Harsh acceleration: Jackrabbit starts burn significantly more fuel than smooth acceleration to the same speed.
- Hard braking: Every hard stop wastes the kinetic energy that fuel already paid for.
- Excessive idling: Addressed in detail in the next section, but idling is often the single largest controllable waste source.
A four-step coaching loop that works:
- Collect two to four weeks of baseline telematics data per driver — speed events, idle time, harsh acceleration/braking counts.
- Identify the bottom quartile and schedule individual 15-minute coaching sessions with their direct supervisor.
- Activate in-cab audio alerts for speed and idle thresholds so drivers get real-time feedback without waiting for a weekly report.
- Run a monthly scorecard with a small incentive (gift cards, extra PTO, public recognition) for drivers who improve the most.
A supervisor coaching script that works: “Your data shows you’re averaging 12 idle events per shift over 5 minutes each. That’s roughly [X] gallons per week just sitting still. Here’s what I want you to try this week…” Keep it specific, non-punitive, and tied to data the driver can see themselves.
Complement coaching with enforcement tools: speed governors on highway-heavy routes, fuel-card time and location locks, and telematics-triggered alerts sent to dispatch when a driver exceeds a threshold.
What maintenance and vehicle specs reduce fuel consumption?
Maintenance is the lowest-cost fuel lever most fleets underuse. Correct tire pressure alone can improve fuel economy by 0.5–3.3% — a small number that compounds across a large fleet. Clean air filters, correct oil viscosity per OEM specification, and proactive fuel-system diagnostics each add incremental gains that stack.

Specification decisions, however, often outperform behavioral coaching for the same vehicle. Penske’s guidance is direct: rightsizing and spec decisions can deliver bigger returns than continuous behavioral programs because they remove waste at the source rather than managing it through enforcement.
Key maintenance and spec levers:
- Tire pressure: Check weekly, not monthly. Under-inflation is the most common and most correctable fuel drain.
- Aerodynamic fairings: Side skirts and roof fairings on box trucks and trailers reduce drag meaningfully at highway speeds.
- Lightweight upfitting: Aluminum shelving and composite body panels cut payload weight without reducing capacity.
- Engine right-sizing: A vehicle spec’d for maximum payload that rarely carries full loads is burning fuel to move unnecessary engine and drivetrain mass.
- Gear ratio optimization: Trucks geared for heavy hauling that run mostly empty routes are over-revving at highway speeds.
Pro Tip: Prioritize your lowest-MPG vehicles first. Fuel-economy gains are non-linear: raising MPG from 8 to 10 saves far more dollars per year than raising MPG from 18 to 20 on the same mileage. Your worst performers are your biggest opportunity.
How much fuel does idling waste, and how do you stop it?
Heavy-duty diesel engines consume approximately one gallon per hour at idle. For lighter gasoline vehicles, the range is roughly 0.25–0.8 gallons per hour depending on engine size and AC load. A driver who idles 90 minutes per shift across a 250-day work year burns 375+ gallons annually — just sitting still.
Practical idle-reduction tactics:
- Set a five-minute idle policy and enforce it through telematics alerts, not just verbal reminders.
- Install automatic engine start-stop systems on vehicles that idle for climate control.
- Use auxiliary power units (APUs) on sleeper trucks and vehicles that need sustained HVAC without running the main engine.
- Pre-cool or pre-heat vehicles during scheduled maintenance windows rather than letting drivers idle before departure.
- Establish clear driver rules: engine off within two minutes of arriving at a job site unless temperature extremes require otherwise.
Idle cost stat: At $3.50/gallon, a heavy-duty diesel idling one hour per day costs roughly $3.50 per vehicle per day — over $875 per vehicle annually on a 250-day schedule. Multiply that across a 50-truck fleet and you are looking at $43,750 in preventable annual spend from idling alone.
Pro Tip: When setting idle policies, give drivers clear guidance on acceptable engine-restart cycles. Frequent short restarts on older vehicles can cause starter wear that costs more than the fuel saved. A practical rule: shut down for any stop expected to exceed five minutes; restart freely for stops under two minutes.
What fuel procurement strategies lower your pump costs?
Fuel cards with enforced controls are the fastest procurement win. Geotab’s data confirms that cards integrated with telematics and transaction restrictions materially reduce unauthorized purchases and provide the audit trail needed to catch fuel leakage. Without card controls, you are essentially running an honor system.
Procurement options ranked by implementation speed:
- Fleet fuel cards with controls: Set time-of-day restrictions, per-transaction gallon limits, approved fuel types, and geographic limits. Activate immediately.
- Preferred supplier networks: Negotiate volume discounts with a regional chain or a national fleet fuel network. Requires volume commitment but delivers per-gallon savings.
- Bulk/onsite fuel tanks: High capital cost but maximum per-gallon savings and full control over fuel quality. Best for fleets with a central depot and 20+ vehicles.
- Partial pre-buy or fixed-price contracts: Lock in a portion of expected fuel volume at a fixed price to reduce exposure to price spikes. Consult your fuel supplier about availability.
Procurement control checklist:
- Activate time-of-day and day-of-week restrictions on all cards.
- Set per-transaction gallon limits that match each vehicle’s tank capacity.
- Require odometer entry at every fill-up for automatic MPG calculation.
- Run a weekly receipt-to-telematics reconciliation to catch mismatches.
- Maintain a preferred supplier list and restrict card use to approved locations.
How do you convert fuel savings into dollars for leadership?
Sample ROI math makes the business case concrete. Take a 50-truck fleet averaging 15 MPG and 25,000 miles per year per vehicle, at $3.50/gallon.
- Baseline annual fuel spend: 50 trucks × (25,000 ÷ 15) × $3.50 = $291,667
- After 10% MPG improvement (16.5 MPG): 50 × (25,000 ÷ 16.5) × $3.50 = $265,152
- Annual savings: $26,515
Add idle reduction: if each truck idles 45 fewer minutes per day (225 hours/year), at 0.5 gallons/hour for a gas engine, that is 112 gallons saved per truck, or 5,600 gallons fleet-wide — roughly $19,600 at $3.50/gallon.
Combined first-year estimate: $60,000+ in savings on a 50-truck fleet from three levers alone.
Report weekly on idle percentage and MPG by driver. Report monthly on fuel cost per mile, route efficiency, and total spend versus budget. Attribute savings to specific initiatives by comparing the metric before and after each change, not fleet-wide averages that blend everything together.
ROI stat: FleetRabbit’s aggregated data shows disciplined programs combining telematics, routing, maintenance, and coaching can deliver 10–20% MPG improvement in the first 90 days.
What does a 30/60/90-day fuel reduction plan look like?
A time-boxed rollout prevents the common failure mode: doing everything at once, measuring nothing, and concluding that “fuel programs don’t work.”
Days 1–30 (Measure and control):
- Pull the 14-day baseline audit (MPG by driver and vehicle, idle percentage, unauthorized events).
- Activate fuel card controls: time restrictions, gallon limits, odometer entry requirements.
- Conduct a fleet-wide tire pressure check and correct any under-inflation.
- Brief all drivers on the program: what is being measured, why it matters, and what the incentive structure looks like.
- Owner: Fleet manager. Milestone: baseline data in hand, card controls live.
Days 31–60 (Coach and pilot):
- Run individual coaching sessions for the bottom quartile of drivers.
- Pilot time-aware routing on your two highest-mileage corridors.
- Activate telematics idle alerts and speed event notifications.
- Begin weekly driver scorecards and share results with supervisors.
- Owner: Operations supervisor + dispatch lead. Milestone: bottom-quartile drivers show measurable improvement.
Days 61–90 (Scale and procure):
- Roll out successful routing pilots fleet-wide.
- Renegotiate fuel supplier contracts using your new volume data.
- Make replacement or re-spec decisions for the three to five highest-consumption vehicles.
- Establish month-over-month reporting for leadership with dollar savings attributed by initiative.
- Owner: Fleet manager + procurement. Milestone: full program live, first monthly savings report delivered.
Pro Tip: Embed fuel KPIs into daily shift handovers. When the morning supervisor mentions yesterday’s idle percentage alongside job completion rate, fuel efficiency becomes a normal operational metric — not a special project that fades after 90 days.
What does the research actually show about fuel savings?
The evidence on specific levers is strong and consistent across agency and industry sources.
Key findings with strong multi-source backing:
- Speed: Fueleconomy aggressive driving cuts fuel economy 15–30% at highway speeds. Each 5 mph over 50 mph costs the equivalent of $0.24–$0.29 per gallon.
- Idling: AFDC data puts heavy-duty diesel idle consumption at approximately one gallon per hour — a hard number that makes the ROI case for idle policies straightforward.
- Driver feedback devices: The same fueleconomy.gov source puts average improvement from feedback devices at ~3%, rising to ~10% for actively engaged drivers.
- Coaching contribution: FleetRabbit’s aggregated research indicates coaching can account for roughly 40% or more of realized fuel improvements when applied systematically.
- Telematics + enforcement: Geotab’s analysis shows driver behaviors like speeding and idling can impact fuel use by up to ~30% — and that telematics-enforced card controls close the procurement leakage gap.
Expect the lower end of that range in the first 90 days and build toward the upper end as dispatch discipline improves.
How do eco-driving training programs work in practice?
Eco-driving training is not a one-time safety briefing. The programs that deliver lasting fuel savings combine classroom or video instruction with in-cab feedback tools and regular performance reviews. The core curriculum covers smooth acceleration and braking, speed management on highway segments, anticipatory driving (reading traffic ahead to avoid unnecessary stops), and idle reduction habits.
The most effective format pairs a short initial training session (two to three hours) with ongoing in-cab coaching through telematics alerts. Drivers who receive real-time feedback on their own behavior improve faster than those who only hear about their performance in a weekly report. Some fleets use gamification platforms that display driver scores on a leaderboard, which creates peer accountability without requiring supervisor intervention on every event.
Training programs should be refreshed quarterly, not annually. Behavior drift is real: drivers who score well in month two often regresses by month six without reinforcement.
How does predictive maintenance prevent fuel-wasting breakdowns?
Predictive maintenance uses telematics engine data — fault codes, coolant temperature trends, oil pressure readings, and fuel trim data — to flag mechanical issues before they cause a breakdown or a measurable MPG drop.
Modern telematics platforms surface these signals automatically. The practical workflow: set threshold alerts for fault codes associated with fuel-system issues, review flagged vehicles within 24 hours, and schedule proactive service before the next dispatch. This approach prevents the double cost of a roadside breakdown — the tow and repair bill plus the fuel wasted during the degraded-performance period leading up to it.
Predictive maintenance also extends vehicle life, which matters for lifecycle cost calculations when you are deciding whether to re-spec or replace an asset.
How does cargo management reduce fuel use through weight control?
Every 100 pounds of unnecessary weight costs roughly 1% in fuel economy on a light-duty vehicle, according to fueleconomy.gov’s maintenance guidance. On a service fleet where trucks carry tools, parts, and equipment daily, unmanaged cargo weight adds up fast.

The practical fix is a truck inventory audit. Walk every vehicle and remove anything that is not used on a regular basis. Common offenders: duplicate tool sets left from previous technicians, obsolete parts that never got returned to the warehouse, and personal items that accumulate over months. Beyond the audit, truck inventory management systems that track what is on each vehicle prevent the second-trip problem — a technician driving back to the shop for a part that should have been stocked eliminates both the wasted miles and the unnecessary weight from over-stocking “just in case.”
Lightweight shelving and storage systems (aluminum versus steel) reduce the fixed weight penalty of upfitting without reducing carrying capacity.
How do you benchmark your fleet’s fuel consumption against industry standards?
Benchmarking without a reference point is just reporting. The U.S. Department of Energy’s fueleconomy.gov and the Alternative Fuels Data Center (AFDC) publish fuel economy data by vehicle class and model year, giving you a defensible external standard for each vehicle type in your fleet. The North American Council for Freight Efficiency (NACFE) publishes run-on-less benchmarks for commercial trucks.
The practical benchmarking process: compare your fleet’s actual MPG per vehicle against the EPA combined rating for that vehicle’s model year and spec. Use these gaps to prioritize your coaching and maintenance queue rather than treating all vehicles equally.
Peer benchmarking — comparing your cost per mile against industry averages for your sector — requires data from fleet associations or telematics providers that aggregate anonymized fleet data. This gives you a competitive context that internal benchmarks alone cannot provide.
How should fuel costs factor into fleet replacement and expansion decisions?
Fuel cost is a lifecycle cost input, not just an operating budget line. When evaluating whether to replace a high-consumption vehicle, the math should include: current annual fuel spend for that vehicle, projected fuel spend at the replacement vehicle’s rated MPG, maintenance cost trajectory, and residual value of the current asset.
A vehicle that costs $8,000/year in fuel and $4,000/year in maintenance, with a $15,000 trade-in value, may justify replacement with a vehicle that cuts fuel spend to $5,500/year — even if the acquisition cost is higher. The trucking finance options available for fleet upgrades can make the capital case easier when the annual savings clearly exceed the financing cost.
For expansion decisions, spec the new vehicles for the actual duty cycle from day one. Over-spec’d vehicles carry unnecessary engine mass and drivetrain complexity that costs fuel on every route. Right-sizing at acquisition is cheaper than re-spec’ing later.
What alternative fuels and vehicle types should you consider?
Compressed natural gas (CNG) and propane autogas are established alternatives for high-mileage fleets with centralized fueling infrastructure. CNG vehicles typically cost less per mile in fuel than diesel at current prices, though the infrastructure investment and limited range make them best suited for return-to-base operations. The AFDC’s alternative fuels station locator helps identify whether your routes have adequate fueling coverage.
Electric vehicles (EVs) are increasingly viable for light-duty service fleets with predictable daily mileage under 150 miles and depot charging. The fuel cost per mile for an EV is substantially lower than gasoline or diesel at current electricity rates in most U.S. markets, and federal tax incentives under the Inflation Reduction Act can offset acquisition costs for qualifying commercial vehicles. Medium-duty electric trucks are expanding in availability but remain limited in range for heavy-payload applications.
Hybrid vehicles offer a practical middle ground for fleets not ready for full electrification: lower fuel consumption than conventional vehicles with no range anxiety or infrastructure dependency.
What operators actually get wrong about sustaining fuel programs
Most fuel programs deliver strong results in the first 90 days and then quietly erode. The reason is almost never the technology. It is the cultural infrastructure around it.
Speed limit enforcement is the most common friction point. Drivers resist it because they feel it affects their productivity — and sometimes they are right. The fix is not to abandon speed limits but to adjust route time estimates to reflect realistic speeds. When a driver can hit their job targets without speeding, the behavior changes. When the schedule still requires 75 mph to make the next appointment, no policy will hold.
Scorecards work only when drivers trust the underlying data. If a driver believes their idle score is being inflated by a faulty sensor or an unfair route comparison, they disengage from the program entirely. Adjust scores for route difficulty and load weight before publishing them. Transparency about the methodology is not optional — it is what separates a program drivers respect from one they resent.
The fleets that sustain improvements beyond 90 days share one habit: fuel KPIs appear in daily shift handovers alongside job completion and revenue metrics. When a supervisor mentions yesterday’s fleet idle percentage in the same breath as job count, fuel efficiency stops being a special initiative and becomes part of how the operation runs.
Jobospro gives home service fleets a faster path to fuel savings
Cutting fuel spend requires visibility, routing intelligence, and cargo control working together — and most home service fleets are running those three functions across disconnected tools. Jobospro’s AI-native operations platform connects telematics data, dispatch scheduling, and truck inventory in a single view, so your team stops making decisions from incomplete information.
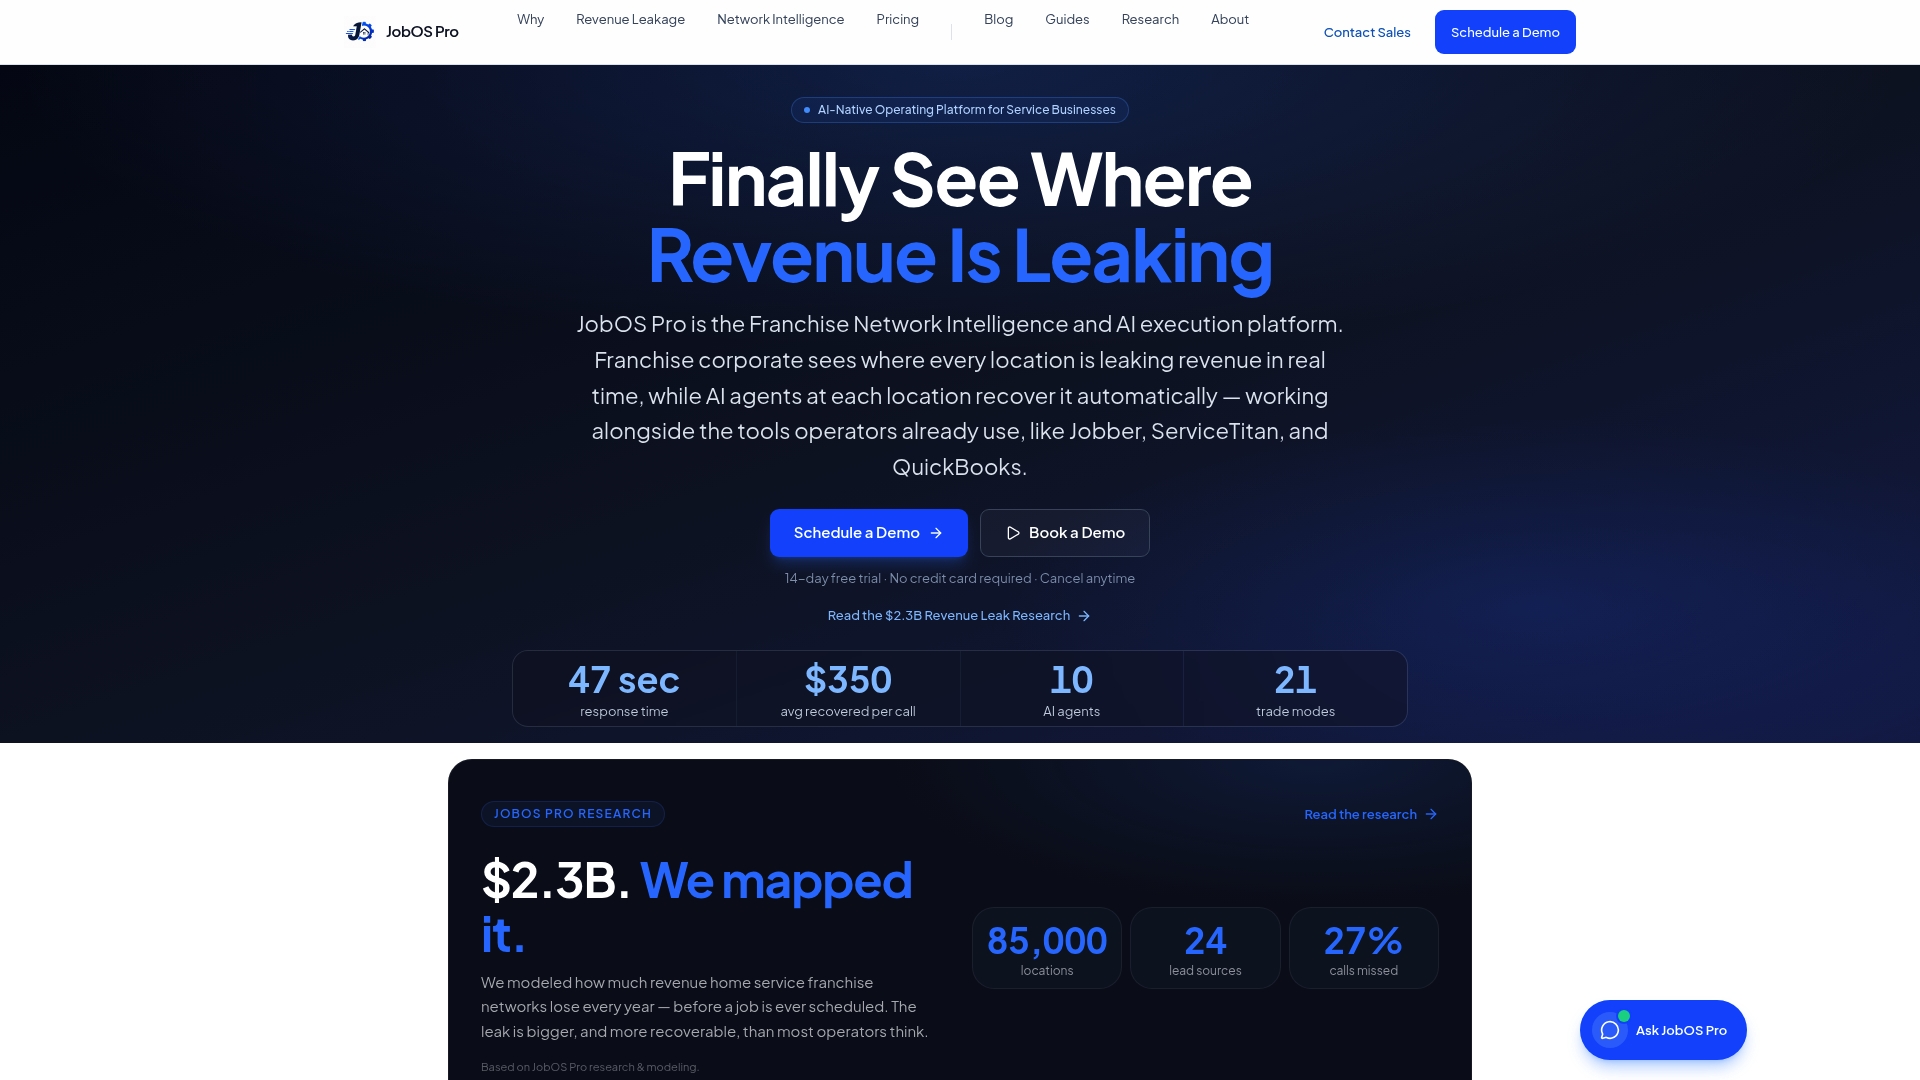
The platform’s route optimization reduces deadhead miles by sequencing jobs intelligently, and its truck inventory management stops the second-trip problem before it burns another gallon. Driver scorecards surface behavior patterns automatically, so supervisors spend time coaching instead of pulling reports. For franchise operators, multi-location benchmarking shows which locations are running efficient routes and which are bleeding fuel spend — and lets you standardize the winning behaviors across the network.
Start a trial or book a demo at Jobospro to see how the platform maps to your fleet’s specific fuel reduction priorities.
Sources
These are the primary government and industry sources used throughout this article. Use them directly for benchmarking targets, policy templates, and ROI validation with your leadership team.
- Fueleconomy
- Heavy-duty vehicle idling report — AFDC
- Fleet MPG optimization — FleetRabbit
- Increase fuel efficiency — Geotab blog
- How to Reduce Fleet Fuel Costs in 2026: A Strategic Executive Guide