
Cut Costs 15% With Operational Scheduling Analytics for Home Service
Cut Costs 15% With Operational Scheduling Analytics for Home Service
Scheduling analytics uses booking, staffing, and time data to spot patterns humans miss: which slots waste labor, which routes bleed hours, which shifts run thin. The direct payoff is fewer idle hours, less overtime, and higher utilization across your team. Most operators start with descriptive dashboards, then layer in forecasting, and eventually add optimization models once the basics are solid.
TL;DR:
- Proactive scheduling analytics can reduce labor waste and improve utilization by predicting demand, wait times, and staffing needs before issues occur.
- Key metrics such as utilization rate, wait time, idle time, and no-show rate enable managers to identify low-efficiency patterns quickly and take targeted action.
- Starting with reliable descriptive dashboards is essential before deploying predictive models or advanced optimization to avoid poor data quality and faulty decisions.
- Integrating real-time alerts, benchmarking across multiple locations, and using existing tools like Jobber or QuickBooks streamline implementation and accelerate value realization.
- Security measures like role-based access, encryption, and data retention policies are critical to protect sensitive customer and employee information in scheduling systems.
Table of Contents
- What Scheduling Analytics Is and Why It Matters to Your Operation
- The Metrics and Dashboards Worth Tracking
- Where Scheduling Analytics Pays Off Fastest
- Three Levels of Analysis: Dashboards, Forecasts, and Optimization Models
- A Practical Roadmap for Getting Started
- How JobOS Pro Puts This Into Practice for Home Service Teams
- Handling Scheduling Data Responsibly
- Where Most Teams Get This Wrong
- Speed Up Your Path From Dashboard to Recovered Revenue
- Sources
- FAQ
What Scheduling Analytics Is and Why It Matters to Your Operation
Scheduling analytics pulls from booking systems, cancellation logs, service duration records, telephony data, CRM notes, staff rosters, and (for field teams) travel times. Combined, that data answers a question most owners only guess at: where is time actually going?
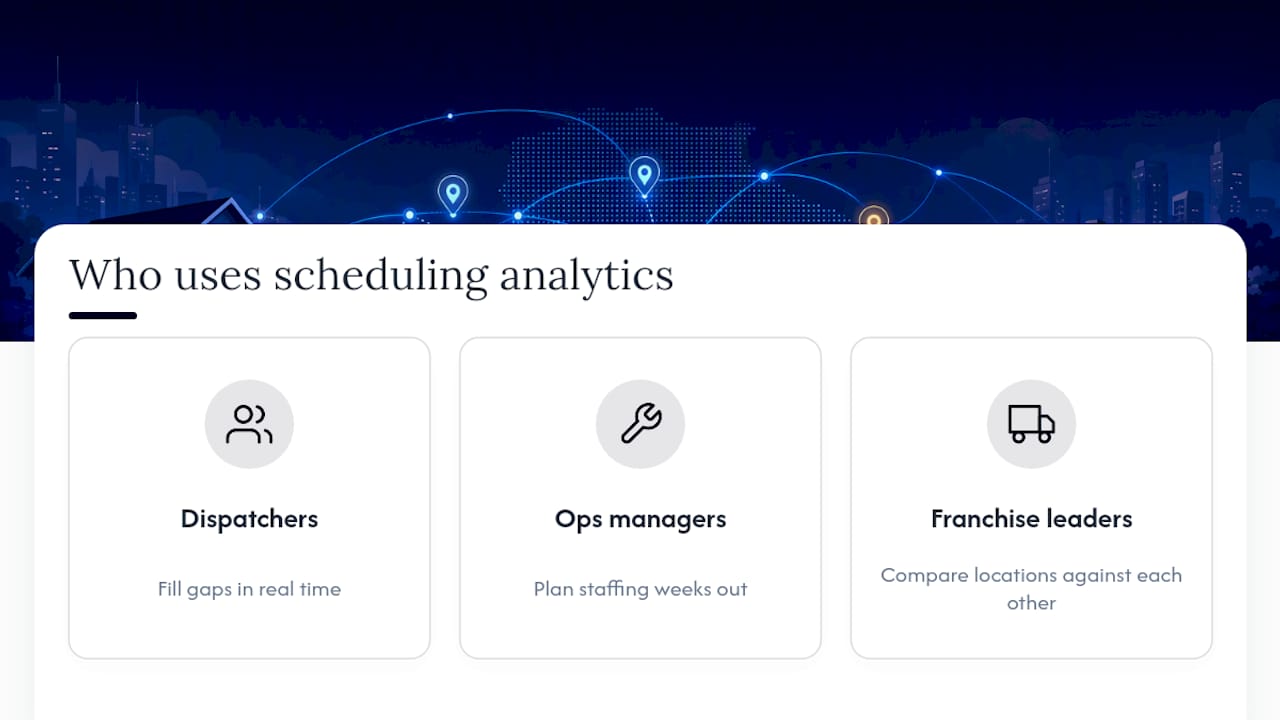
The stakeholders vary by business. Dispatchers use it to fill gaps in real time. Operations managers use it to plan staffing weeks out. Franchise leaders use it to compare locations against each other. Each role reads the same numbers differently, but all of them benefit when wait times shrink, overtime drops, and throughput rises without adding headcount.
The industry is shifting fast on this front. Nucleus Research reports that workforce operations are moving away from reactive, manually adjusted schedules toward proactive decision analytics that blends real time data with AI to catch coverage gaps and labor cost spikes before they hit payroll. That shift matters because reactive scheduling only tells you what already went wrong. Proactive analytics tells you what’s about to.
The Metrics and Dashboards Worth Tracking
You don’t need forty KPIs. You need the handful that actually predict revenue leakage and burnout before they show up on a P&L.
Start with these:
- Utilization rate: booked hours divided by available hours, tracked by tech or by team
- Wait time: elapsed time between a customer’s requested slot and their actual appointment
- Idle time: gaps between jobs where a crew or resource sits unused
- Overtime rate: hours worked beyond standard shift length, as a percentage of total hours
- No-show rate: missed appointments divided by total scheduled appointments
- Travel time per route: average drive time between jobs, critical for field service
- Revenue per slot: average ticket value generated per booked time block
For dashboard design, slot heatmaps (showing which hours and days fill fastest), team leaderboards, and a rolling capacity calendar give managers a visual read on where the schedule is straining. A well-built executive dashboard condenses these into a single view leadership can scan in under a minute.
Pro Tip: *Set alert thresholds, not just dashboards.
Watch trend direction more than absolute numbers. A utilization rate of 78% might be fine in one market and alarming in another, depending on your historical baseline.
Where Scheduling Analytics Pays Off Fastest
The clearest wins show up in four areas, and they tend to compound once you start measuring them together.
- Appointment-slot optimization: adjusting slot length and spacing based on actual service duration data cuts wait times and lets you book more jobs per day without rushing techs.
- Staffing and shift adjustment: matching crew size to demand patterns by hour and day reduces overtime while closing coverage gaps during peak windows.
- Route-aware sequencing: for home services, ordering jobs by location and travel time (not just booking order) lowers drive time and raises completed jobs per technician per day.
- Revenue protection: flagging missed callbacks, delayed follow-ups, and abandoned estimates before they become lost jobs.
Frontline buy-in matters here too. Workday and DailyPay’s 2026 research found that a large majority of frontline workers say control over their schedule is a top priority, and managers are increasingly turning to AI tools to match shifts against worker preferences and skills. Analytics that ignore that human layer tend to optimize the calendar while quietly increasing turnover.
Three Levels of Analysis: Dashboards, Forecasts, and Optimization Models
Most businesses move through three stages, and skipping ahead rarely works.
Descriptive dashboards come first. They show what already happened: last week’s utilization, this month’s no-show rate, which slots book out fastest. Low effort, fast to build, and immediately useful for spotting obvious problems.
Predictive forecasting comes next. Machine learning models can forecast demand, no-show likelihood, and even service duration before a job starts. One outpatient scheduling study built a Cluster-Predict-Schedule system using clustering and an XGBoost prediction model, then used Monte Carlo simulation to pick the best schedule template. The result: operational costs dropped as much as about fifteen percent compared with simple first-call-first-appointment booking.
Stochastic and optimization models are the deepest layer. Distributionally robust optimization, or DRO, produces more reliable routing and appointment schedules when travel times and service durations are uncertain, which is nearly always the case in field service. A stochastic optimization study on home service routing shows these models (referred to as W-DHRAS and M-DHRAS) can be reformulated as mixed-integer linear programs solvable with standard solvers, avoiding the need for custom algorithms.
- Descriptive: fast, cheap, immediately useful for spotting trends
- Predictive: needs clean historical data and moderate technical setup
- Stochastic/optimization: needs volume, computational capacity, and a team that trusts the output
Pro Tip: Don’t jump to optimization models before your descriptive dashboards are reliable. Garbage data in a Monte Carlo simulation just produces confident-sounding garbage out.
A Practical Roadmap for Getting Started
You don’t need a data science team to start. You need a plan and the discipline to follow it in order.
- Define one or two primary KPIs. Pick a baseline, usually overtime rate or utilization, and measure it for two weeks before changing anything.
- Map and ingest your data sources. Connect booking software, telephony, and staff rosters so numbers sync automatically instead of living in spreadsheets.
- Run quick descriptive analyses. Build slot heatmaps and check no-show patterns by day and time to surface fast, low-risk wins.
- Pilot predictive or simulation-based scheduling. Test on one team or one location before rolling out company-wide.
- Operationalize with clear ownership. Assign someone to review the dashboard weekly and set guardrails for when a metric triggers action.
| Roadmap step | What success looks like |
|---|---|
| Define KPIs | One clear baseline number tracked consistently |
| Ingest data | Systems sync without manual entry |
| Descriptive analysis | Heatmaps reveal at least one fixable pattern |
| Predictive pilot | Forecast accuracy improves scheduling in a test group |
| Operationalize | A named owner reviews metrics on a set cadence |
How JobOS Pro Puts This Into Practice for Home Service Teams
JobOS Pro was built as an AI-native platform from the ground up, not bolted onto legacy scheduling software after the fact. Its dispatch and scheduling board applies the same layered approach outlined above: real-time visibility first, then automated detection of the revenue leaks that scheduling analytics is designed to catch.
- Flags missed calls and scheduling delays as they happen, not in a weekly report
- Runs alongside existing tools like Jobber and QuickBooks instead of forcing a system migration
- Gives franchise operators multi-location benchmarking to compare scheduling performance across every site
- Ties scheduling delays directly to revenue leakage tracking so managers see the dollar impact, not just the calendar gap
That structure maps closely to the implementation roadmap: data ingestion, alert thresholds, and a clear owner reviewing the dashboard. The difference is that the alerting and benchmarking run automatically rather than requiring a manual build.
Handling Scheduling Data Responsibly
Scheduling data is sensitive in ways people underestimate. It includes customer addresses, phone numbers, appointment histories, and often employee location data if you’re tracking field crews with GPS or geofencing.
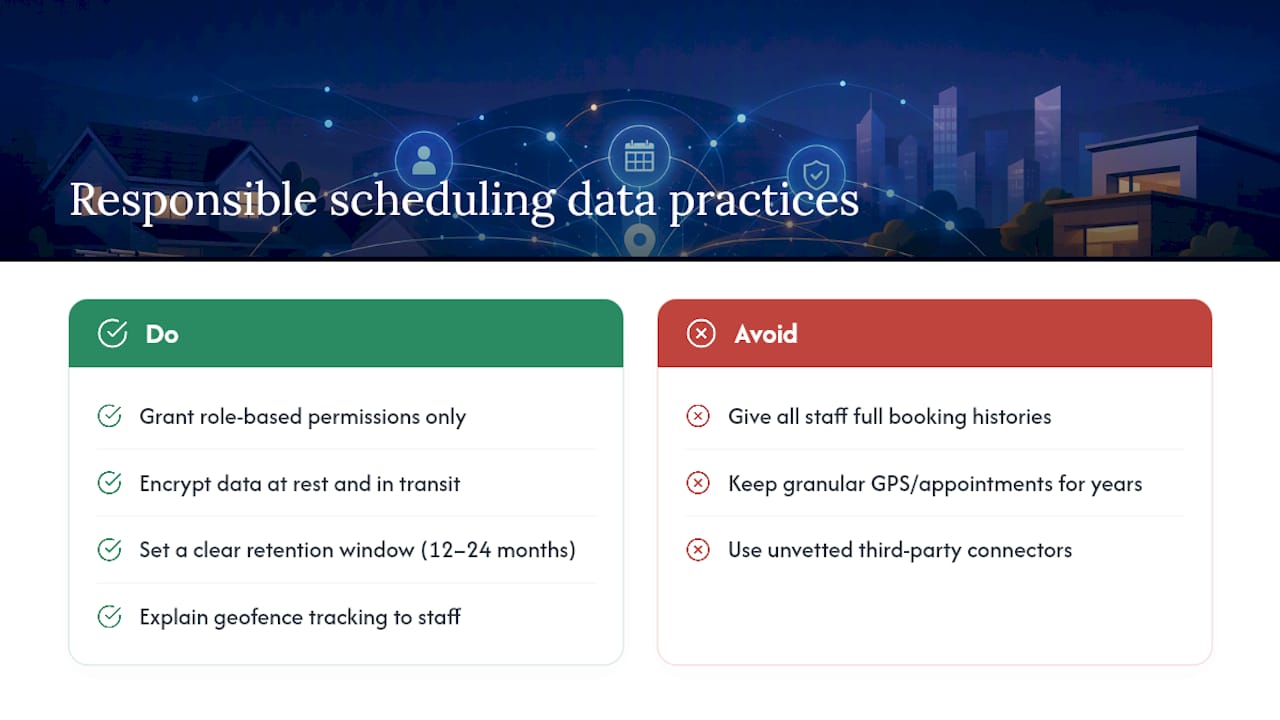
Start with access control. Not every team member needs visibility into every customer’s full booking history, and not every manager needs raw GPS logs on individual technicians. Role-based permissions limit exposure and reduce the blast radius if credentials get compromised.
Encryption matters both at rest and in transit, especially when data flows between your scheduling system, your CRM, and your accounting software. Any integration point is a potential leak, so vet third-party connectors the same way you’d vet a new hire handling customer files.
Retention policy deserves more attention than it usually gets. Keeping years of granular appointment and location data past its useful life increases risk without adding value. Set a clear window (often 12 to 24 months for operational data) and purge beyond it unless a specific business or legal reason requires longer storage.
If you’re using tools like geofenced time tracking to feed travel time data into your analytics, confirm employees understand what’s tracked and why. Transparency here isn’t just good practice; it reduces friction and pushback from staff who might otherwise view tracking as surveillance rather than a scheduling tool.
Where Most Teams Get This Wrong
Run a limited pilot before rolling out anything company-wide. Pick one KPI, fix your data quality first, and resist the urge to deploy a complex model before you’ve made basic operational changes.
The biggest trap isn’t technical. It’s skipping change management and assuming a dashboard alone will fix a scheduling problem that’s really a communication problem. Measure, adjust, measure again.
— Tarun
Speed Up Your Path From Dashboard to Recovered Revenue
Building scheduling analytics from scratch, wiring together telephony, booking software, and staff rosters, takes months most home service owners don’t have to spare. JobOS Pro closes that gap by running the layered approach this article describes automatically: real-time alerts on missed calls and scheduling delays, benchmarking across locations, and integration with the tools you already use like Jobber and QuickBooks, so you skip the rebuild and go straight to the insight.
If you run a single location, the Starter plan at $199 a month gets core revenue-recovery and scheduling visibility running fast. Franchise operators managing multiple sites should look at the Enterprise tier for cross-location benchmarking. Start by reading the free guide to AI dispatch, then book a demo to see your own scheduling data mapped against these metrics in real time.
Sources
- Workforce operations in 2026: turning real-time insight into action — Nucleus Research
- Stochastic optimization models for a home service routing and appointment scheduling problem — arXiv (2105.01725)
- An adaptive decision support system for outpatient appointment scheduling with heterogeneous service times — Scientific Reports (Nature) 2024
FAQ
What does a scheduling analyst do?
A scheduling analyst monitors booking, staffing, and utilization data to spot inefficiencies like overtime spikes, idle time, and no-show patterns. They build dashboards, run forecasts, and recommend schedule adjustments to operations managers.
What is the most commonly used scheduling analysis software?
There’s no single dominant tool since businesses vary widely by industry and scale. Home service operators increasingly use AI-native platforms like JobOS Pro, which combines scheduling analytics with revenue-leak detection and integrates with existing systems like Jobber and QuickBooks.
What are the four main types of data analytics?
The four types are descriptive (what happened), diagnostic (why it happened), predictive (what will happen), and prescriptive (what to do about it). Scheduling analytics typically progresses through descriptive dashboards first, then predictive forecasting, and eventually prescriptive optimization models.
What are the three types of scheduling?
Scheduling approaches generally fall into fixed scheduling (set shifts with little variation), flexible or demand-based scheduling (shifts adjusted to forecasted need), and dynamic or real-time scheduling (continuous adjustment as conditions change). Home service businesses increasingly rely on the dynamic model since travel time and job duration shift daily.
How much does JobOS Pro cost?
JobOS Pro offers multiple subscription plans, with detailed pricing available on its pricing page. Full plan details are available on the pricing page.