
People First Service Capacity Planning for Field Services
People First Service Capacity Planning for Field Services
Service capacity planning means forecasting future demand and sizing your people, skills, and schedules to meet it, without burning out your team or padding your bench too thick. The single move to make this week: run a 30-day headroom check using booked commitments plus weighted pipeline, then surface two numbers, booked utilization and months-to-ceiling for your most constrained role or resource.
TL;DR:
- Conduct a 30-day headroom check to compare booked utilization and months-to-ceiling for your most constrained resource and act before the capacity gap materializes.
- Use demand forecasting methods like weighted pipeline, trend analysis, and scenario modeling, combining human judgment with statistical data for better accuracy.
- Convert forecasted demand hours into role-specific headcount and skills, maintaining utilization targets of 70 to 85 percent to avoid quality or retention issues.
- Implement an automated, unified capacity planning system that tracks real-time data across scheduling, pipeline, and utilization to improve responsiveness and stakeholder buy-in.
- Regularly review KPIs such as booked utilization, months-to-ceiling, forecast accuracy, bench cost percentage, and trigger response times every 30 to 90 days for continuous improvement.
Table of Contents
- What Is Service Capacity Planning and Why Services Are Different?
- What Are the Steps in the Capacity Planning Process?
- Should You Plan Strategically, Tactically, or Operationally?
- How Do You Forecast Demand for Service Capacity?
- How Do You Turn a Demand Forecast Into Staffing Requirements?
- What Should a Rolling Capacity Plan Template Include?
- What Tools and Data Do You Need to Plan Reliably?
- How JobOS Pro Maps to These Capacity Planning Inputs
- How Do You Balance Capacity and Demand When They Don’t Match?
- How Do You Manage Risk in a Capacity Plan?
- Which KPIs Actually Show Whether Your Capacity Plan Is Working?
- How Do You Get Stakeholder Buy-In for a Capacity Plan?
- How Does Capacity Planning Connect to Budgeting?
- What Managers Actually Need to Own Here
- Put Your Capacity Plan on Autopilot
- Where to Go Deeper on Capacity Planning
- Sources
- FAQ
What Is Service Capacity Planning and Why Services Are Different?
Service capacity planning is the practice of matching people-hours and skills to expected demand, using committed work, pipeline probability, and delivery history as your raw material. It sits one level below broader resource planning and feeds ongoing capacity management, which is the continuous discipline of watching utilization and adjusting as reality shifts.
Manufacturing capacity planning revolves around machines: fixed throughput, predictable maintenance windows, known unit costs. Service capacity planning revolves around people, and people are far less predictable than a conveyor belt.
- Skills don’t scale linearly. Hiring one more electrician doesn’t instantly replace a departing senior technician’s judgment.
- Utilization has a ceiling long before 100%. Push billable or booked hours too high and quality, retention, or both start slipping.
- Demand arrives in probabilities, not fixed orders. A signed contract behaves differently in your model than a pipeline opportunity at 40% close probability.
A services-focused capacity approach treats people and skills, not equipment, as the constrained resource, which changes almost every downstream decision.
What Are the Steps in the Capacity Planning Process?
A formal capacity planning process runs through five repeatable stages, and skipping any one of them is usually where plans fall apart.
- Assess current capacity. Inventory every person, their skills, their committed hours, and current utilization by role.
- Forecast demand. Blend weighted pipeline, historical trends, and known event windows (seasonal spikes, marketing pushes, contract renewals).
- Identify bottlenecks. Find where forecasted demand exceeds available skilled hours, and list your levers: redeploy staff, hire, bring in contractors, or automate lower-value tasks.
- Develop and implement a response. Pick the lever (or combination) that fits your timeline and budget, and put it into motion before the gap arrives, not after.
- Monitor and adjust. Track outcomes against your forecast weekly or monthly, and feed the variance back into the next cycle.
Azure’s well-architected guidance frames this loop similarly: gather data, forecast, understand resource limits, then test whether those limits actually hold under real load. The services version of that test is simpler to run but easier to ignore.
Should You Plan Strategically, Tactically, or Operationally?
Capacity planning works on three horizons, and each one demands a different level of confidence and a different type of data.
- Strategic planning (6 to 12+ months): Headcount budgets, market expansion, and major hiring cycles. Built on trend lines and business goals, not day-to-day bookings.
- Tactical planning (30 to 90 days): Contractor decisions, near-term hiring, and territory shifts. This is where your rolling forecast lives and where most managers spend their planning time.
- Operational planning (daily to weekly): Shift assignments, dispatch, and same-week overtime calls. Built on real-time bookings and today’s callouts.
Layered onto those horizons are three response strategies. Lead capacity means staffing ahead of forecasted demand, useful when hiring lead times are long, like specialized trades. Match capacity means adjusting resources in close step with actual demand, common in professional services with flexible contractor pools. Lag capacity means adding resources only after demand is confirmed, which minimizes bench cost but risks lost revenue during the gap.
Most service organizations blend all three: lead on hard-to-hire skills, match on general labor, and lag on anything easily covered by overtime or contractors in the short term.
How Do You Forecast Demand for Service Capacity?
Forecasting accuracy improves when you combine statistical methods with human judgment rather than trusting either one alone. Azure’s capacity guidance points to a mix of expert input, small pilot tests, and external data as the strongest combination, and that logic transfers directly to service teams.
Useful techniques include:
- Time-series and trend analysis on historical booking volume, broken out by service line and season.
- Regression modeling that ties demand to leading indicators, like marketing spend or lead volume, a few weeks out.
- Weighted pipeline forecasting, where each open opportunity contributes hours based on its close probability rather than counting it as a full commitment.
- Predictive models layered on top of your CRM data once you have at least a year of clean history.
- Small pilots, testing a new service offering with a limited crew before committing full headcount.
Build at least three scenarios: base case, optimistic, and surge. Attach known triggers to each, like a product launch, a seasonal spike, or an acquisition that suddenly doubles your customer base.
Pro Tip: Pull your marketing calendar into the same forecast as your CRM pipeline. A campaign that lands three weeks before a seasonal peak can double your booked-hours gap almost overnight, and most capacity misses trace back to forecasts built without that context.
Essential inputs to collect before you model anything: CRM pipeline with probability weighting, historical delivery patterns by role, SLOs and SLIs where you run measurable service commitments, and your marketing or sales calendar.
How Do You Turn a Demand Forecast Into Staffing Requirements?
Once you have a demand number, the real work starts: converting hours into headcount, skills, and budget. Start by translating forecasted demand into raw hours, then map those hours against the specific skills required, not just a generic headcount total. A forecast that says “1,200 hours of HVAC work next quarter” is useless until you know how many of those hours require licensed technicians versus apprentices.
Set utilization targets with real bands, not a single number. Most service organizations aim for billable or booked utilization somewhere in the 70 to 85% range, leaving deliberate bench capacity for training, travel, and demand spikes.
- Convert forecasted demand into people-hours by role and skill level.
- Apply your utilization target to determine required headcount, not just available hours.
- Flag hard limits early: hiring lead time, contractor availability, vendor quotas, software or equipment licensing caps.
- Build a bench-cost baseline so hire-versus-contract decisions are based on real numbers, not gut feel.
The Tier2 Systems services guide frames this well: professional services capacity planning is as much about skills matching as it is about raw headcount, and a bench-cost baseline is what makes the hire-or-contract call defensible to finance. A crew that’s fully booked on paper but missing one certified technician still has a capacity gap, even though the utilization dashboard looks healthy.
What Should a Rolling Capacity Plan Template Include?
A usable plan states the critical constraint plainly, attaches a timeline, and puts a cost on every recommended action, so leadership can make a trade-off call in minutes, not weeks.
Structure it in three parts: an executive summary, a headroom table, and a trigger table.
The executive summary should name the single most critical constraint (say, “licensed electricians in the Southeast region”), give a months-to-ceiling estimate, recommend one immediate action, and attach its rough cost.
The headroom table tracks capacity by resource type:
The trigger table sets thresholds and pre-approved actions:
- Watch (75% to 84% utilization): Flag in weekly report, no action required yet.
- Act (85% to 94% utilization): Open contractor conversations, begin hiring process, request overtime approval.
- Emergency (95%+ or under 1 month to ceiling): Freeze new bookings in the affected line, escalate to leadership, execute contingency hires.
Run this template every 30, 60, and 90 days on a rolling basis, refreshing the forecast rather than starting from scratch each quarter.
What Tools and Data Do You Need to Plan Reliably?
Capacity plans built on stale spreadsheets fail quietly, usually about two weeks before someone notices. The minimum telemetry you need: booked hours by role, real-time utilization, pipeline-weighted demand, SLO/SLI performance where you have measurable commitments, and queue or backlog length for anything customers are waiting on.
- PSA and workforce planning platforms track booked hours, skills, and scheduling in one place.
- CRM integrations feed pipeline probability directly into your demand forecast instead of relying on manual exports.
- Monitoring dashboards surface utilization and backlog trends daily rather than at month’s end.
- Forecasting and modeling tools, including approaches like Netflix’s open-source capacity modeling framework, show how simulation can rank resourcing options when the variables get complex.
The fastest path to reliability: unify pipeline data, current commitments, and time tracking into one weekly headroom report. Most teams get more value from that single unified report than from another six months of spreadsheet tweaking.
How JobOS Pro Maps to These Capacity Planning Inputs
The inputs above (booked hours, pipeline, utilization, service commitments) usually live in four disconnected systems, which is exactly the gap JobOS Pro was built to close for home service businesses.
- Connects scheduling, dispatch, and time tracking so booked hours and utilization update in real time instead of at month-end.
- Surfaces missed calls, uncollected payments, and scheduling delays as revenue leaks, which often mask themselves as capacity problems when they’re really process gaps.
- Generates automated headroom alerts tied to the same watch/act/emergency logic managers already use in a rolling plan.
- Gives franchise and multi-location operators benchmarking across sites, so corporate leaders can standardize winning behaviors instead of each location reinventing its own capacity spreadsheet.
For a network running the same trigger table across five or fifty locations, that shared visibility is the difference between a plan and a guess.
How Do You Balance Capacity and Demand When They Don’t Match?
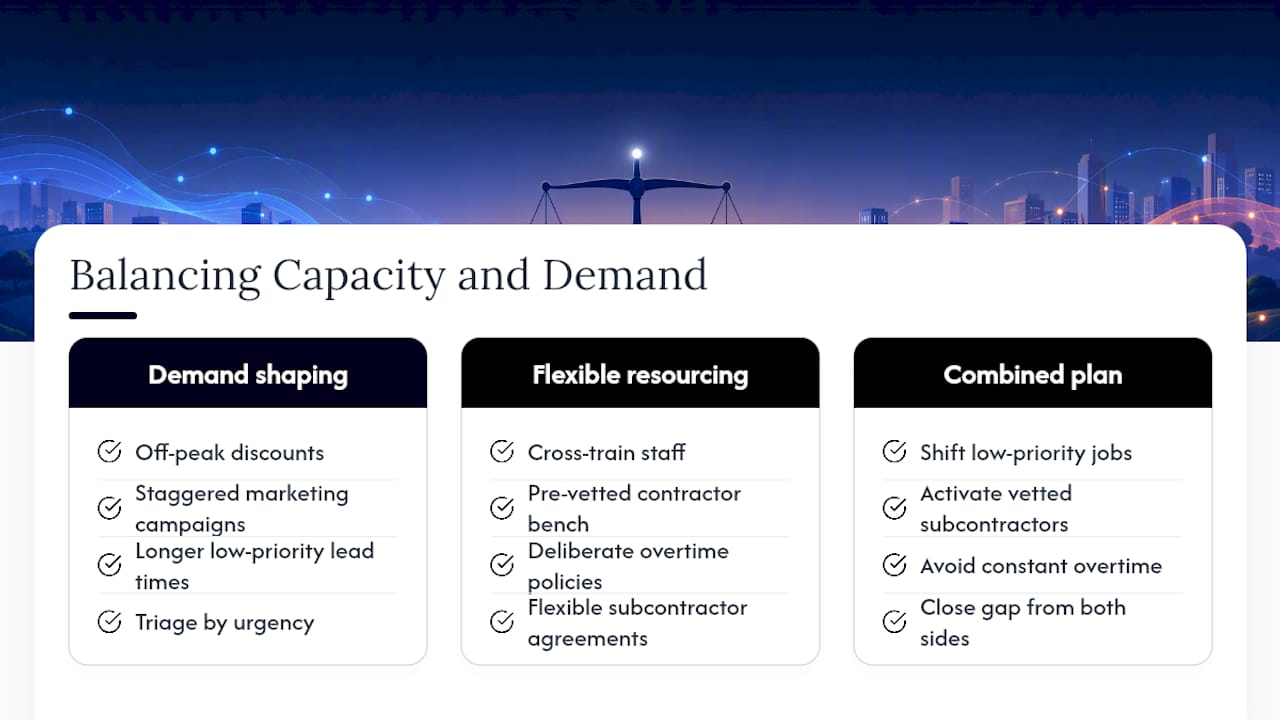
Demand rarely lines up neatly with available capacity, and the fix usually runs in both directions: shape demand down and flex capacity up, at the same time.
Demand shaping means influencing when and how much work arrives instead of just reacting to it. Field service businesses do this by offering off-peak scheduling discounts, staggering marketing campaigns so leads don’t all land in the same week, or setting longer lead times for lower-priority service tiers during a known busy season. Professional services firms shape demand by staging project kickoffs, negotiating flexible start dates with clients, or triaging incoming requests by urgency rather than first-come-first-served.
Flexible resourcing works the other side of the equation. Cross-training staff across adjacent skill sets lets you redeploy people during a spike instead of hiring cold. A qualified contractor bench, vetted and ready before you need them, cuts the lag between “we’re overbooked” and “we have coverage.” Overtime policies, used deliberately rather than as a default fallback, absorb short bursts without a hiring commitment. Some organizations also negotiate flexible-capacity agreements with subcontractors or partner firms, essentially buying an option on extra hours before they’re needed.
The strongest plans combine both levers rather than leaning on one. Shaping demand alone can frustrate customers if it’s overused. Flexing capacity alone gets expensive if every spike gets solved with overtime pay. A construction services firm facing a seasonal surge might shift lower-priority jobs two weeks out (demand shaping) while simultaneously activating three pre-vetted subcontractors (flexible resourcing), closing the gap from both sides instead of overloading either lever.
How Do You Manage Risk in a Capacity Plan?
Every capacity plan is a bet on a forecast, and forecasts are wrong often enough that risk management deserves its own line item, not an afterthought.
Start by naming your two failure modes separately, because they require different contingencies. A demand surge (unexpected volume, a viral marketing hit, a competitor exiting the market) needs a pre-approved surge plan: which contractors get called first, what overtime budget is pre-authorized, and which lower-priority work gets paused. A resource shortfall (a key technician quits, a contractor pulls out, a hiring freeze hits at the wrong time) needs a different playbook: cross-trained backups identified in advance, a standing relationship with a staffing agency, and a clear escalation path so the gap doesn’t sit unaddressed for weeks.
Build contingency triggers directly into your capacity plan rather than treating them as a separate document nobody reads. The trigger table structure covered earlier does double duty here: it’s both a monitoring tool and a risk mitigation plan, because the actions at each threshold are decided calmly, in advance, instead of under pressure during the actual surge.
Diversify where your flexibility comes from. Relying on a single contractor relationship or one cross-trained employee to cover every gap is a single point of failure. Spread flexible capacity across at least two or three sources, whether that’s multiple contractor relationships, a broader cross-training program, or a mix of overtime and temporary staffing. Revisit your risk assumptions every quarter, because the contractor who was reliably available last year may not be this year, and a shortfall plan built on outdated availability data isn’t really a plan.
Which KPIs Actually Show Whether Your Capacity Plan Is Working?
A capacity plan without measurement is a document, not a management tool. Track a small set of KPIs consistently rather than drowning in a dashboard nobody checks.
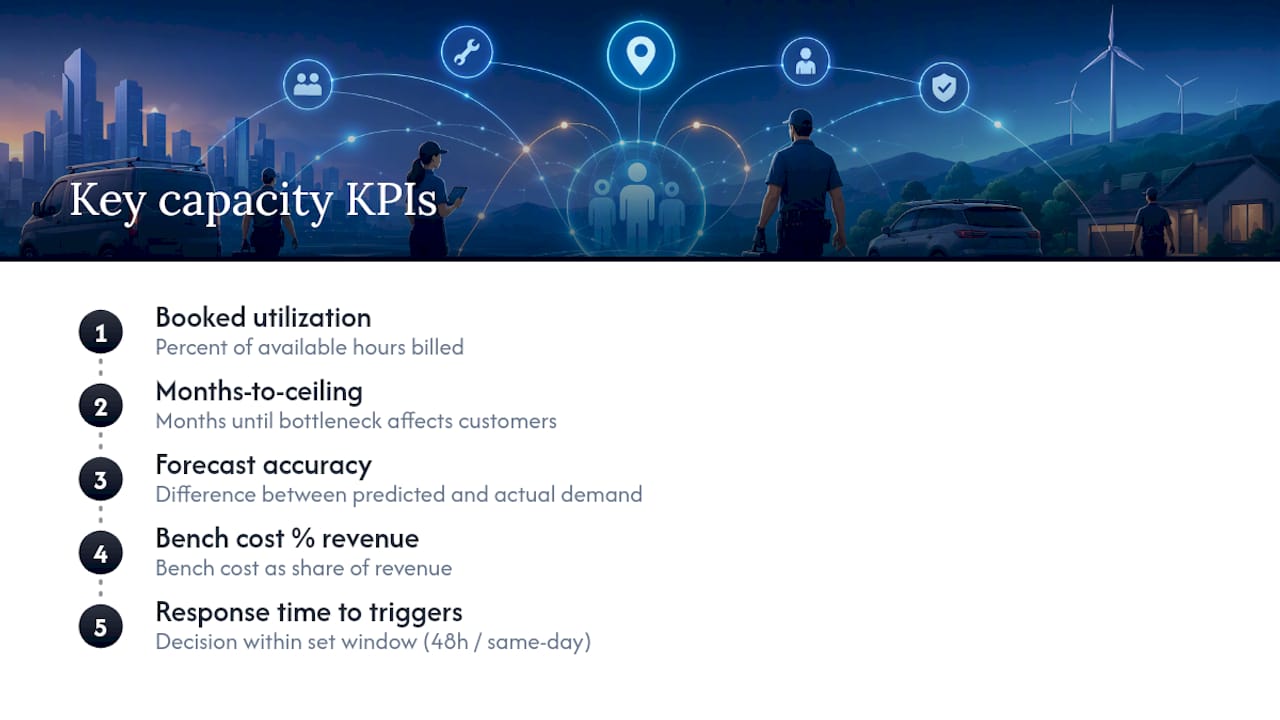
Booked or billable utilization is your foundation metric, the percentage of available hours actually committed to paying work. Track it by role and by location, not just as a company-wide average, since a healthy overall number can hide one overloaded team and one underused one.
Months-to-ceiling for your most constrained resource tells you how much runway you have before a bottleneck becomes a customer-facing problem. This number should update every planning cycle, not sit static in a slide deck.
Forecast accuracy, meaning how close your predicted demand came to actual demand, tells you whether to trust your model or rebuild it. If you’re consistently off by more than 15 to 20% in either direction, your inputs need attention before your response strategy does.
Bench cost as a percentage of revenue keeps the lead/match/lag decision honest. Too low, and you’re probably understaffed for the next spike. Too high, and you’re carrying cost the business doesn’t need.
Response time to triggers measures whether your watch/act/emergency thresholds actually produce action, or whether they get flagged and ignored. A trigger that fires without a corresponding decision within a set window (say, 48 hours for “act,” same-day for “emergency”) is a governance gap, not a data gap.
Review these five together, monthly at minimum, weekly during a known surge window. A plan that only gets revisited quarterly is reacting to problems that started months earlier.
How Do You Get Stakeholder Buy-In for a Capacity Plan?
A capacity plan that lives only in the operations team’s spreadsheet rarely survives contact with a budget meeting. Buy-in has to be built deliberately, with the right information reaching the right people before a crisis forces the conversation.
Finance needs to see the plan in dollars, not just headcount. Translate months-to-ceiling and bench cost into revenue-at-risk language: “if we don’t add two technicians by month two, we forecast $40,000 in lost bookings from turned-away work.” That framing gets budget approval faster than a utilization percentage ever will.
Frontline managers and team leads need to understand the trigger table specifically, because they’re usually the ones who notice a shortfall first, days before it shows up in a report. Give them a plain-language version: what utilization number means “flag this,” and who to flag it to.
Executive leadership wants the one-page executive summary described earlier, the critical constraint, the timeline, the recommended action, and the cost. Anything longer risks getting skimmed or shelved.
The cultural piece matters as much as the format. Teams that share pipeline and utilization data openly, instead of guarding it, catch capacity gaps weeks earlier than teams that only surface a problem once it’s already hurting delivery. Set a recurring cadence, ideally the same 30/60/90 rolling review used for the forecast itself, so stakeholders see the plan evolve rather than encountering it once a year as a surprise.
How Does Capacity Planning Connect to Budgeting?
Capacity planning and financial planning are the same conversation held in two different departments, and treating them separately is where most disconnects start. A hiring decision driven by a capacity trigger has a direct line to headcount budget, and a budget cut has a direct line back to how much headroom your team actually has next quarter.
Build your capacity plan’s cost estimates using the same categories finance already tracks: fully loaded headcount cost, contractor day rates, overtime premiums, and software or equipment licensing. When your headroom table shows “hire 2 FTEs or add 1 contractor,” attach a real dollar range to each option so the finance conversation starts with numbers instead of a request for “more people.”
Align your rolling 30/60/90 capacity cadence with your existing budget review cycle wherever possible. If finance reviews spend monthly and your capacity plan refreshes every 30 days, that’s a natural sync point. Mismatched cadences (a quarterly budget review paired with a capacity plan nobody updates between meetings) are how surprise headcount requests happen.
The bench-cost baseline mentioned earlier does double duty here. It’s both an operational lever and a budget line, since bench cost run too high shows up as a margin problem before it shows up as a scheduling one. Bring your capacity plan into annual budget season with real scenario numbers attached, base, optimistic, and surge, so finance is planning against the same assumptions operations is using, instead of two separate forecasts arriving at different conclusions.
What Managers Actually Need to Own Here
The mechanics of a capacity plan are the easy part. What separates teams that actually run this from teams that build a template once and abandon it is ownership: someone specific has to own the 30/60/90 cadence and act on triggers the moment they fire, not two weeks later when the emergency threshold is already blown past.
The cultural shift matters more than the spreadsheet. Teams that keep pipeline, commitments, and utilization visible across departments catch gaps early and stop making last-minute hiring decisions under panic. Teams that guard that data in silos find out about a shortfall the same week a client does.
Run the 30-day headroom check this month. Don’t wait for a polished version, iterate from the first draft.
— Tarun
Put Your Capacity Plan on Autopilot
Building the headroom table, trigger thresholds, and weekly report by hand works, until you’re running it across three service lines or five locations and the spreadsheet stops keeping up. Jobospro is built for exactly that gap: it connects your scheduling, dispatch, and time tracking into one live view, so booked utilization and months-to-ceiling update automatically instead of waiting for someone to compile them.
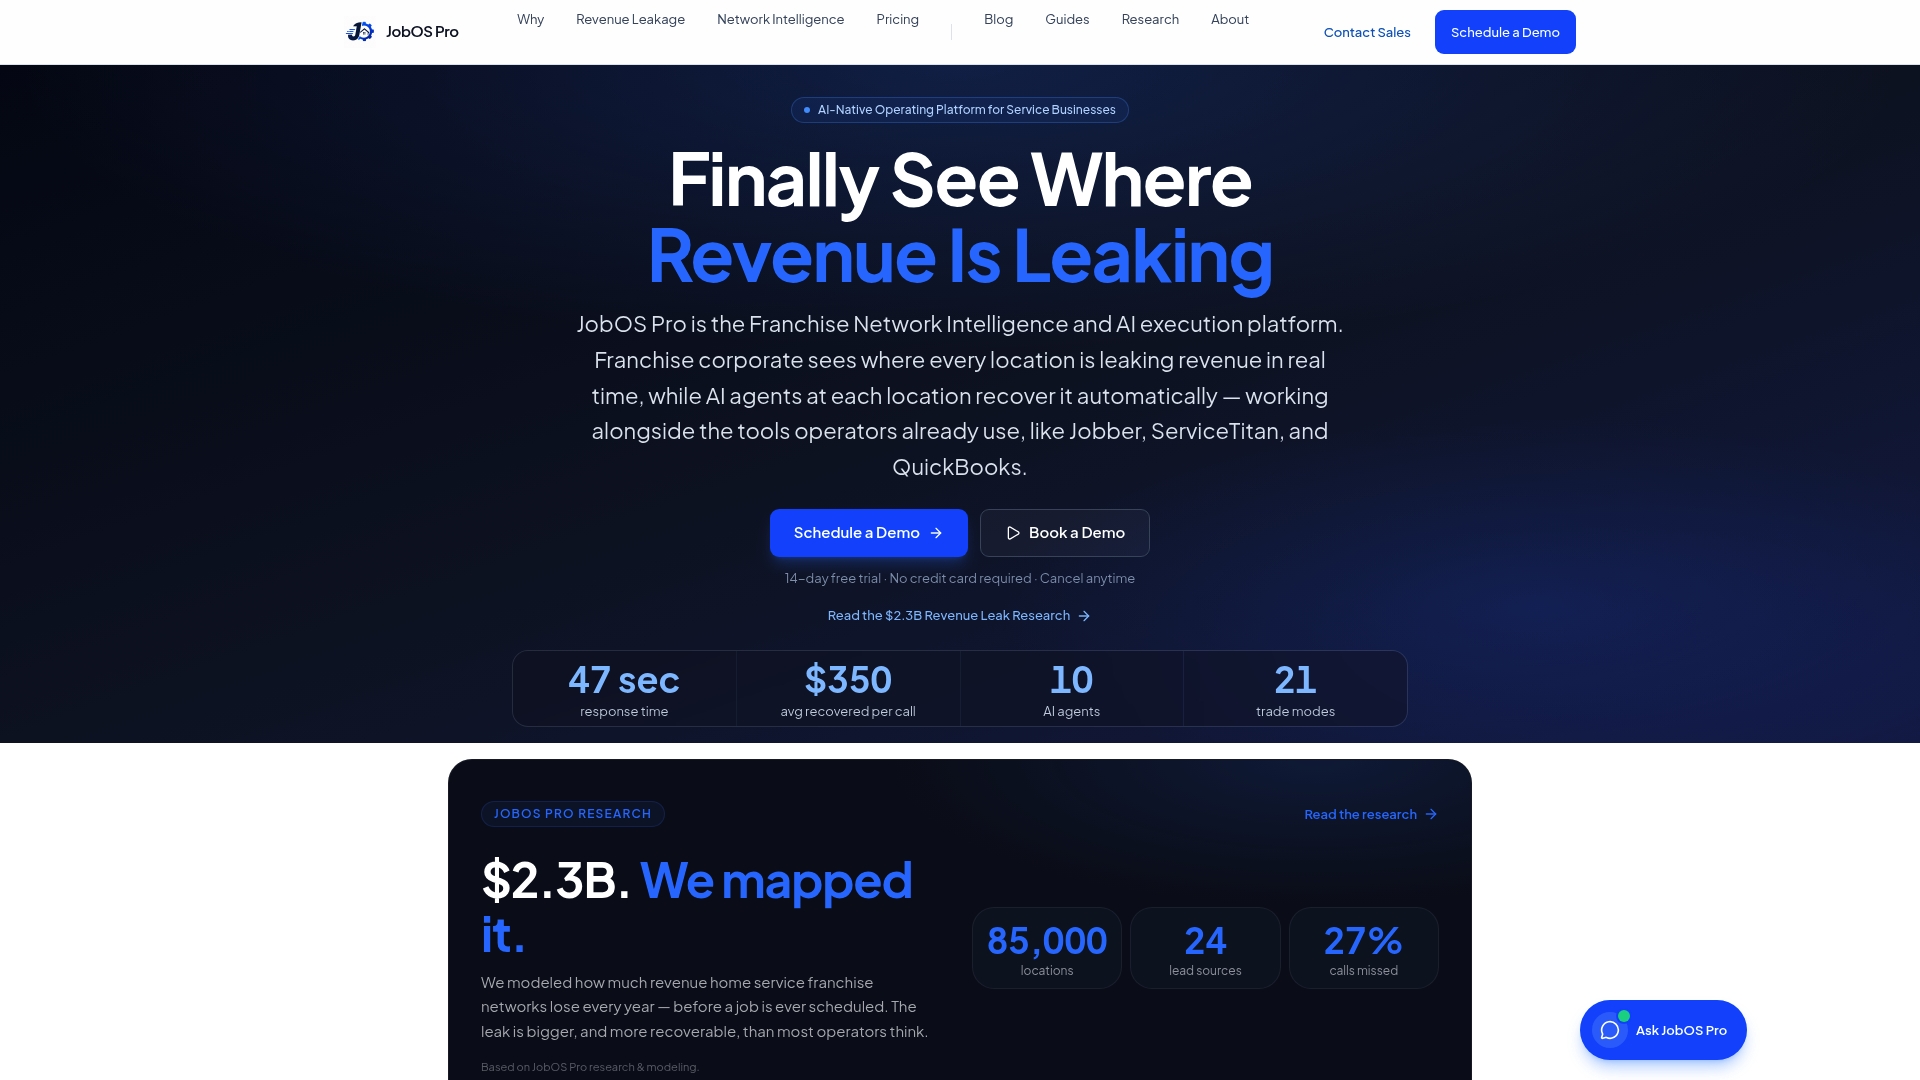
For franchise and multi-location operators, that same data rolls up into cross-site benchmarking, so corporate leadership can see which locations are running lean and which are one busy week away from an emergency trigger, without asking every site manager for a manual report. Independent operators get the same real-time headroom visibility without needing to build the dashboard themselves.
If you’re ready to see what unified capacity data looks like for your business, check current plans and pricing, starting at $199 per month for the Starter tier, or book a demo to walk through how the platform maps to your specific service lines.
Where to Go Deeper on Capacity Planning
For process and technical grounding, IBM’s capacity planning overview and Microsoft’s Azure Well-Architected guidance cover the core methodology in more technical depth. For governance and roles, the ITIL capacity management framework explains how business, service, and component capacity connect. For services-specific templates, Tier2 Systems’ guide and, for engineering-heavy teams, Netflix’s open-source modeling repo are worth bookmarking.
Sources
- What Is Capacity Planning? (IBM)
- Azure Well-Architected: capacity planning (Microsoft Docs)
- Capacity Planning: A Services Firm’s Guide (Tier2 Systems)
- Service-capacity-modeling (Netflix skunkworks GitHub)
FAQ
What Are the Three Types of Capacity Planning?
The three types are strategic (6 to 12+ months, focused on hiring and budget cycles), tactical (30 to 90 days, where rolling forecasts live), and operational (daily to weekly, covering shift and dispatch decisions). Most service organizations run all three simultaneously, layered by time horizon rather than choosing just one.
Can You Provide an Example of a Capacity Plan?
A usable plan has three parts: an executive summary naming the critical constraint and months-to-ceiling, a headroom table showing utilization and gap-closing options by resource, and a trigger table with watch, act, and emergency thresholds tied to pre-approved actions. The headroom and trigger table examples in this guide can be copied directly into a working template.
What Is the Best Tool for Capacity Planning?
The best tool depends on your data maturity, but the minimum requirement is a system that unifies booked hours, pipeline, and utilization in one place rather than spreadsheets updated by hand. For home service businesses specifically, JobOS Pro connects scheduling, dispatch, and time tracking so headroom alerts generate automatically instead of requiring a manual weekly pull.
How Do You Perform Capacity Planning?
Perform capacity planning by assessing current capacity (people, skills, committed hours), forecasting demand using weighted pipeline and historical trends, identifying where the two don’t match, and implementing a response, hire, contract, redeploy, or automate. Then monitor results on a rolling 30/60/90 day cadence and adjust the forecast as real numbers come in.
How Often Should a Capacity Plan Be Updated?
Refresh the plan on a rolling 30, 60, and 90 day cadence rather than rebuilding it from scratch each quarter. During a known demand surge or after a major shortfall, shorten that cycle to weekly until utilization stabilizes back into the watch range.